The Keynesian IS-LM Model
The Keynesian IS-LM Model


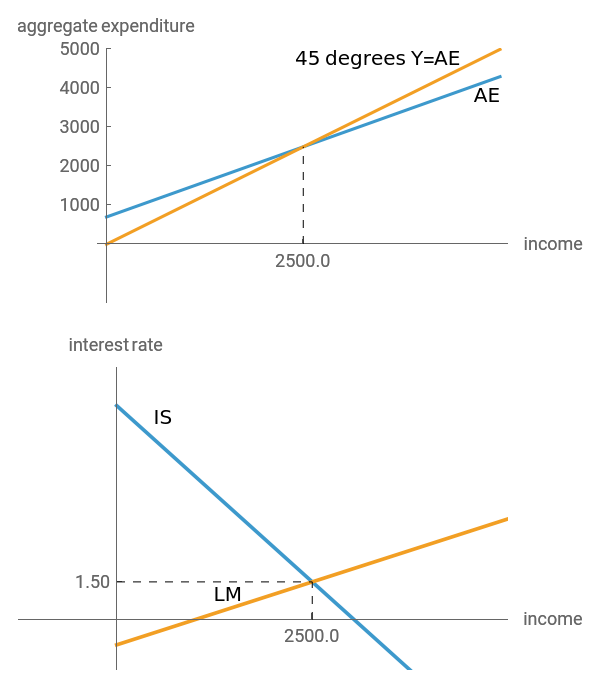
The IS-LM model is a graphical representation of a Keynesian model of the macroeconomy. The model solves for equilibrium in both the goods market and the money market, taking certain parameters as given. The IS line represents the goods market, and the LM line represents the money market.
Details
Details
The IS-LM model was first introduced by John Hicks in 1937. It has been a popular framework for describing the interaction between the goods market and the money market. The interest rate links the two markets by influencing both the demand for investment and the demand for real money balances. In this Demonstration, you can visualize how parameters such as the marginal propensity to consume, the income tax rate, the real money supply, and the sensitivity of certain variables to the interest rate change the slope and position of the IS and LM curves. A "Keynesian Cross" diagram (top panel) is included, as it is in many macroeconomic texts, to reinforce the connection between the two models.
J. R. Hicks, "Mr. Keynes and the 'Classics'; A Suggested Interpretation," Econometrica, 5(2), April 1937 pp. 147-159.
Permanent Citation
Permanent Citation
William J. Polley
"The Keynesian IS-LM Model"
http://demonstrations.wolfram.com/TheKeynesianISLMModel/
Wolfram Demonstrations Project
Published: February 12, 2008