ABSTRACT (original article): Dice control involves “setting” the dice and then throwing them carefully, in the hope of influencing the outcomes and gaining an advantage at craps. How does one test for this ability? To specify the alternative hypothesis, we need a statistical model of dice control. Two have been suggested in the gambling literature, namely the Smith-Scott model and the Wong-Shackleford model. Both models are parameterized by , which measures the shooter’s level of control. We propose and compare four test statistics: (a) the sample proportion of 7s; (b) the sample proportion of pass-line wins; (c) the sample mean of hand-length observations; and (d) the likelihood ratio statistic for a hand-length sample. We want to test :θ=0 (no control) versus :θ>0 (some control). We also want to test :θ≤ versus :θ>, where is the “break-even point.” For the tests considered we estimate the power, either by normal approximation or by simulation. CITATION (original article): Stewart N. Ethier(2025), Testing for dice control at craps, arXiv:2504.13158. https://doi.org/10.48550/arXiv.2504.13158
θ∈[0,1]
H
0
H
1
H
1
θ
0
H
1
θ
0
θ
0
This notebook implements computational methods to analyze dice control in craps using two statistical models: the Smith–Scott (S–S) and Wong–Shackleford (W–S) models. It reparameterizes these models via the expected gain η from a pass-line bet, enabling hypothesis testing for dice-control efficacy. Key tasks include calculating eigenvalues of transition matrices, tail probabilities for hand lengths, and optimal strategies, as described in the paper’s theoretical framework.
Smith--Scott model
Smith--Scott model
This section defines the Smith–Scott (S–S) model , which assumes a shooter reduces off-axis dice rolls by proportion theta ∈ [0, 1]. Functions like pA[x], pB[x], and pC[x] encode probability distributions for dice sets targeting specific face reductions. The code computes reparameterized probabilities pAA[x, theta], pAB[x, theta], etc., as per the paper’s modified S–S formulation, linking theta to the probability of rolling a 7 to test control effectiveness.
Definitions
Definitions
Optimal strategy
Optimal strategy
In[]:=
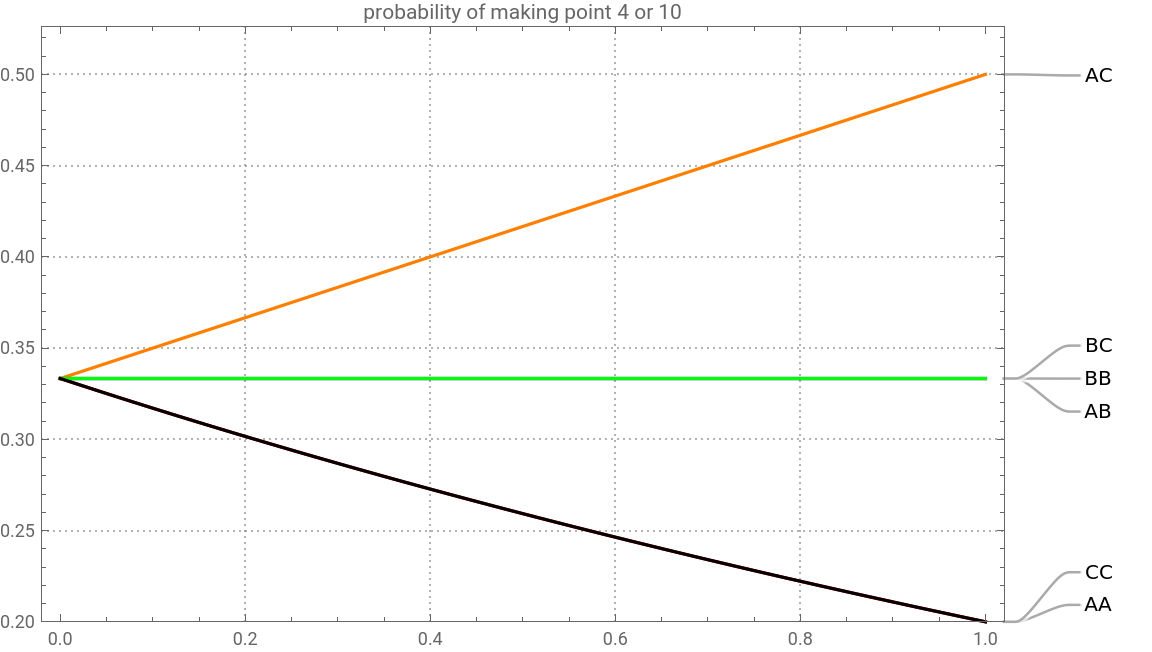
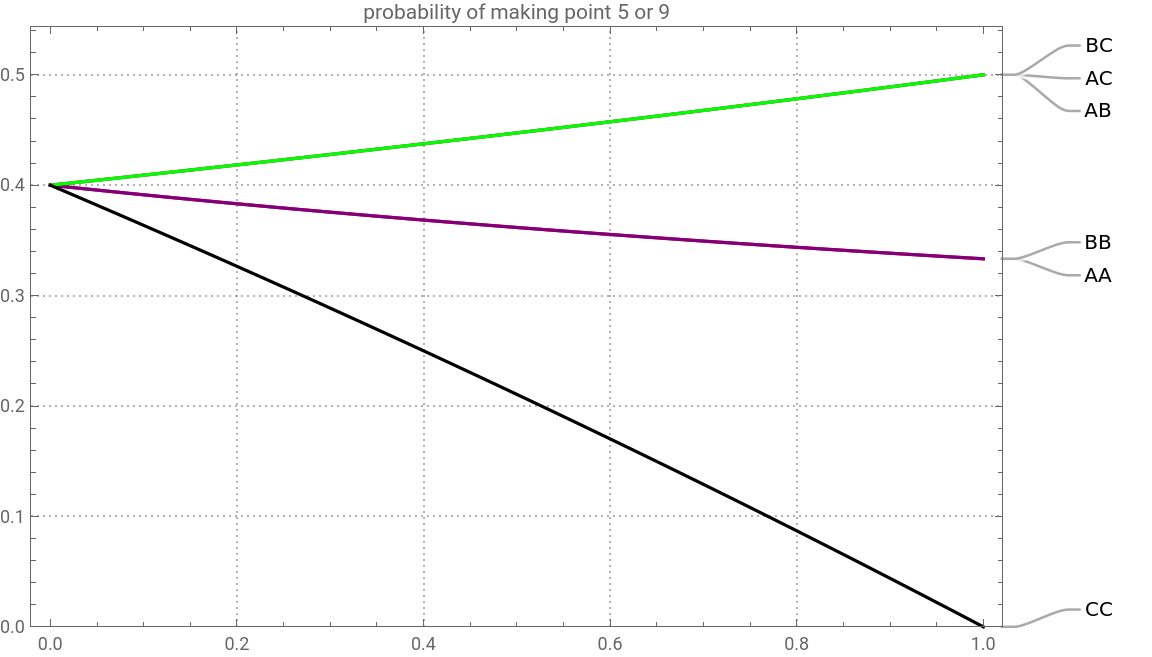
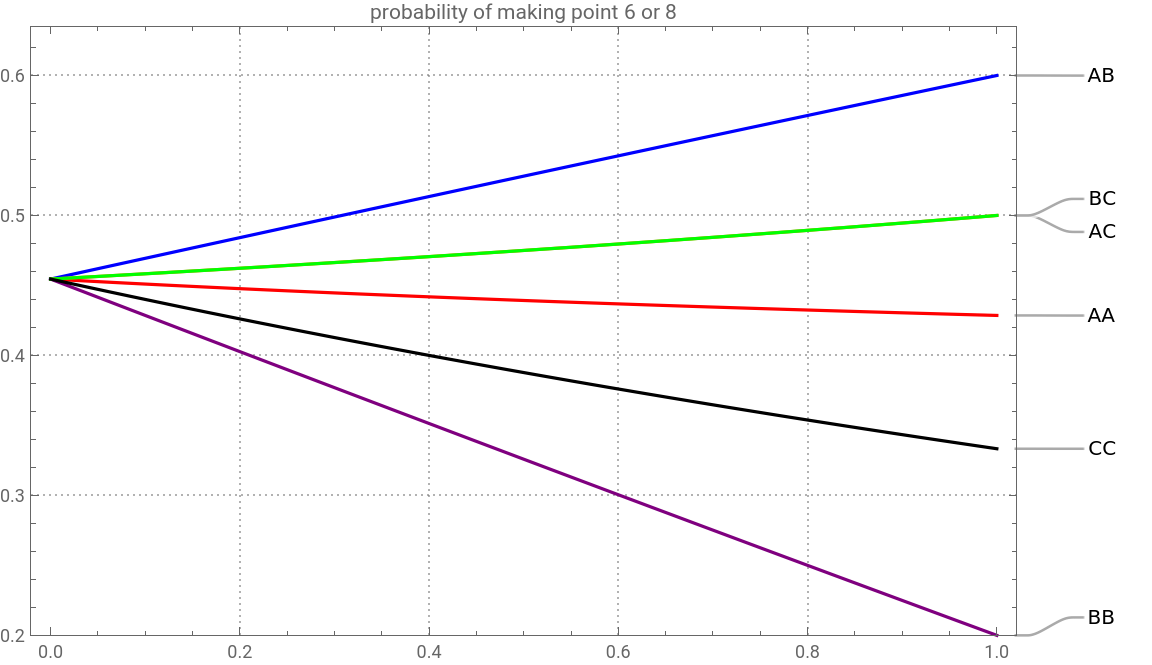
Plot[{pAA[4,theta]/(pAA[4,theta]+pAA[7,theta]),pAB[4,theta]/(pAB[4,theta]+pAB[7,theta]),pAC[4,theta]/(pAC[4,theta]+pAC[7,theta]),pBB[4,theta]/(pBB[4,theta]+pBB[7,theta]),pBC[4,theta]/(pBC[4,theta]+pBC[7,theta]),pCC[4,theta]/(pCC[4,theta]+pCC[7,theta])},{theta,0,1},PlotRange->{0.2,0.5},PlotStyle->{Red,Blue,Orange,Purple,Green,Black},PlotLabels{"AA ","AB ","AC ","BB ","BC ","CC "},PlotTheme->"Detailed",PlotLegends->None,PlotLabel->"probability of making point 4 or 10",ImageSize->Large]Plot[{pAA[5,theta]/(pAA[5,theta]+pAA[7,theta]),pAB[5,theta]/(pAB[5,theta]+pAB[7,theta]),pAC[5,theta]/(pAC[5,theta]+pAC[7,theta]),pBB[5,theta]/(pBB[5,theta]+pBB[7,theta]),pBC[5,theta]/(pBC[5,theta]+pBC[7,theta]),pCC[5,theta]/(pCC[5,theta]+pCC[7,theta])},{theta,0,1},PlotRange->{0,0.5},PlotStyle->{Red,Blue,Orange,Purple,Green,Black},PlotLabels{"AA ","AB ","AC ","BB ","BC ","CC "},PlotTheme->"Detailed",PlotLegends->None,PlotLabel->"probability of making point 5 or 9",ImageSize->Large]Plot[{pAA[6,theta]/(pAA[6,theta]+pAA[7,theta]),pAB[6,theta]/(pAB[6,theta]+pAB[7,theta]),pAC[6,theta]/(pAC[6,theta]+pAC[7,theta]),pBB[6,theta]/(pBB[6,theta]+pBB[7,theta]),pBC[6,theta]/(pBC[6,theta]+pBC[7,theta]),pCC[6,theta]/(pCC[6,theta]+pCC[7,theta])},{theta,0,1},PlotRange->{0.2,0.6},PlotStyle->{Red,Blue,Orange,Purple,Green,Black},PlotLabels{"AA ","AB ","AC ","BB ","BC ","CC "},PlotTheme->"Detailed",PlotLegends->None,PlotLabel->"probability of making point 6 or 8",ImageSize->Large]Plot[{pAA[7,theta]+pAA[11,theta]+2pAA[4,theta]pAC[4,theta]/(pAC[4,theta]+pAC[7,theta])+2pAA[5,theta]pAC[5,theta]/(pAC[5,theta]+pAC[7,theta])+2pAA[6,theta]pAB[6,theta]/(pAB[6,theta]+pAB[7,theta]),pAB[7,theta]+pAB[11,theta]+2pAB[4,theta]pAC[4,theta]/(pAC[4,theta]+pAC[7,theta])+2pAB[5,theta]pAC[5,theta]/(pAC[5,theta]+pAC[7,theta])+2pAB[6,theta]pAB[6,theta]/(pAB[6,theta]+pAB[7,theta]),pAC[7,theta]+pAC[11,theta]+2pAC[4,theta]pAC[4,theta]/(pAC[4,theta]+pAC[7,theta])+2pAC[5,theta]pAC[5,theta]/(pAC[5,theta]+pAC[7,theta])+2pAC[6,theta]pAB[6,theta]/(pAB[6,theta]+pAB[7,theta]),pBB[7,theta]+pBB[11,theta]+2pBB[4,theta]pAC[4,theta]/(pAC[4,theta]+pAC[7,theta])+2pBB[5,theta]pAC[5,theta]/(pAC[5,theta]+pAC[7,theta])+2pBB[6,theta]pAB[6,theta]/(pAB[6,theta]+pAB[7,theta]),pBC[7,theta]+pBC[11,theta]+2pBC[4,theta]pAC[4,theta]/(pAC[4,theta]+pAC[7,theta])+2pBC[5,theta]pAC[5,theta]/(pAC[5,theta]+pAC[7,theta])+2pBC[6,theta]pAB[6,theta]/(pAB[6,theta]+pAB[7,theta]),pCC[7,theta]+pCC[11,theta]+2pCC[4,theta]pAC[4,theta]/(pAC[4,theta]+pAC[7,theta])+2pCC[5,theta]pAC[5,theta]/(pAC[5,theta]+pAC[7,theta])+2pCC[6,theta]pAB[6,theta]/(pAB[6,theta]+pAB[7,theta])},{theta,0,1},PlotRange->{0.45,0.7},PlotStyle->{Red,Blue,Orange,Purple,Green,Black},PlotLabels{"AA ","AB ","AC ","BB ","BC ","CC "},PlotTheme->"Detailed",PlotLegends->None,PlotLabel->"probability of winning pass-line bet, assuming optimal dice sets on point rolls",ImageSize->Large]
Out[]=
Out[]=
Out[]=
Out[]=
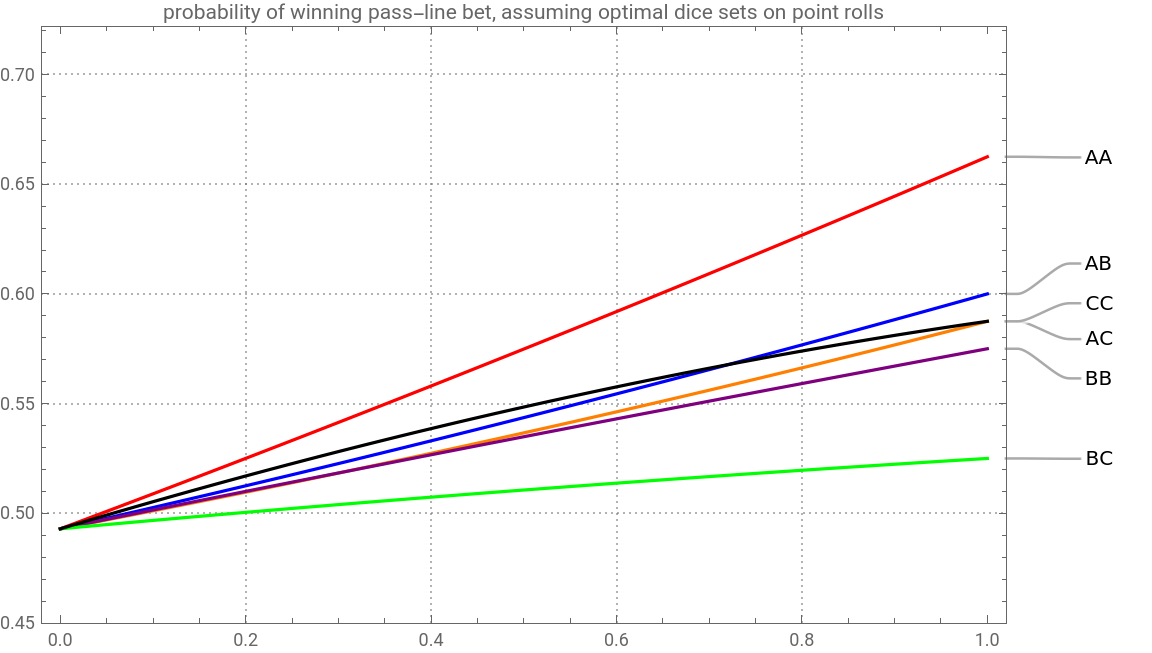
Conclude optimal strategy is AC if point is 4, 5, 9, or 10, and AB if point is 6 or 8, AA on come-out rolls.
Expected gain
Expected gain
In[]:=
EG[theta_]:=2(pAA[7,theta]+pAA[11,theta]+pAA[4,theta]pAC[4,theta]/(pAC[4,theta]+pAC[7,theta])+pAA[5,theta]pAC[5,theta]/(pAC[5,theta]+pAC[7,theta])+pAA[6,theta]pAB[6,theta]/(pAB[6,theta]+pAB[7,theta])+pAA[8,theta]pAB[8,theta]/(pAB[8,theta]+pAB[7,theta])+pAA[9,theta]pAC[9,theta]/(pAC[9,theta]+pAC[7,theta])+pAA[10,theta]pAC[10,theta]/(pAC[10,theta]+pAC[7,theta]))-1;theta=.;Factor[EG[theta]]
Out[]=
-
-448+10064theta-72-68+
2
theta
3
theta
4
theta
72(-10+theta)(44+theta)
In[]:=
rho[theta_]:=-;NSolve[rho[theta]==0,theta]
-448+10064theta-72-68+
2
theta
3
theta
4
theta
72(-10+theta)(44+theta)
Out[]=
{{theta66.8253},{theta12.8481},{theta-11.7179},{theta0.0445299}}
In[]:=
Plot[rho[theta],{theta,0,1}]rho[0]rho[1]
Out[]=
Hand length mean and variance
Hand length mean and variance
Eigenvalues of transition matrix
Eigenvalues of transition matrix
Eigenvectors of transition matrix
Eigenvectors of transition matrix
Replace Root4 above by 144e1, Root3 by 144e2, Root2 by 144e3, and Root1 by 144e4.
Eigenvectors for non-unit eigenvalues are of the form ...
Characteristic polynomial of Q
Characteristic polynomial of Q
Alternative form for non-unit eigenvalues
Alternative form for non-unit eigenvalues
List the polynomials appearing in the above solutions
Example to illustrate theorem
Example to illustrate theorem
Wong--Shackleford model
Wong--Shackleford model
This section implements the Wong–Shackleford (W–S) model , which assumes correlated dice outcomes without favoring on-axis rolls. Functions like q4[a,b,c,d,theta], q5[...], and q6[...] calculate the probability of making the point 4 (or 5 or 6) given the dice set (a,b,c,d) and theta. These align with the paper’s reparameterization of theta to unify comparisons with the S–S model, enabling analysis of optimal betting strategies and statistical power under both frameworks.
Optimal strategy
Optimal strategy
Wong’ s list of the 45 dice sets
Conclude 2323 (or 2424) is optimal for point rolls, 1265 (or 1562) is optimal for come - out rolls. This is Shackleford’ s result.
Expected gain
Expected gain
Reparameterization via eta = EG(theta)
Reparameterization via eta = EG(theta)
We need to find which of the three solutions is the inverse of rho(theta) = eta, taking the interval [-7/495,13/40] to the interval [0,0.674351]. By trial and error, it is the second one.
Hand length mean and variance
Hand length mean and variance
Eigenvalues of transition matrix
Eigenvalues of transition matrix
Characteristic polynomial of Q
Characteristic polynomial of Q
Alternative form for non-unit eigenvalues
Alternative form for non-unit eigenvalues
List the polynomials in theta appearing above.
Example to illustrate theorem
Example to illustrate theorem
CITE THIS NOTEBOOK
CITE THIS NOTEBOOK
Testing for dice control at craps
by Stewart Ethier
Wolfram Community, STAFF PICKS, May 23, 2025
https://community.wolfram.com/groups/-/m/t/3466914
by Stewart Ethier
Wolfram Community, STAFF PICKS, May 23, 2025
https://community.wolfram.com/groups/-/m/t/3466914