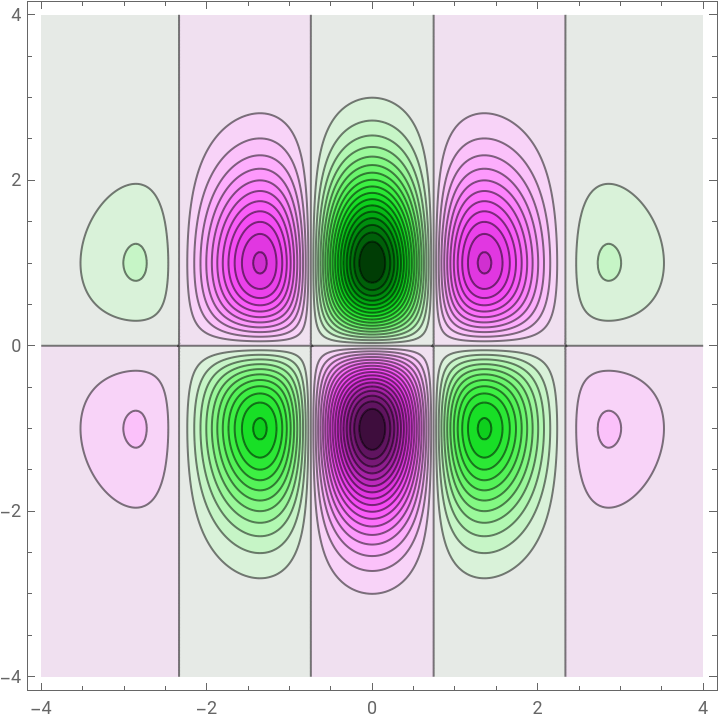
Considerthisplot.Youcanseeallthecontourlinesaresolid.
In[]:=
ContourPlot[Evaluate[g[x,y,1]],{x,-4,4},{y,-4,4},Contours->35,PlotRange->All,PlotPoints->100,ColorFunction->"GreenPinkTones",ContourStyle->Automatic]
∂
x,x,x,x,y
Out[]=
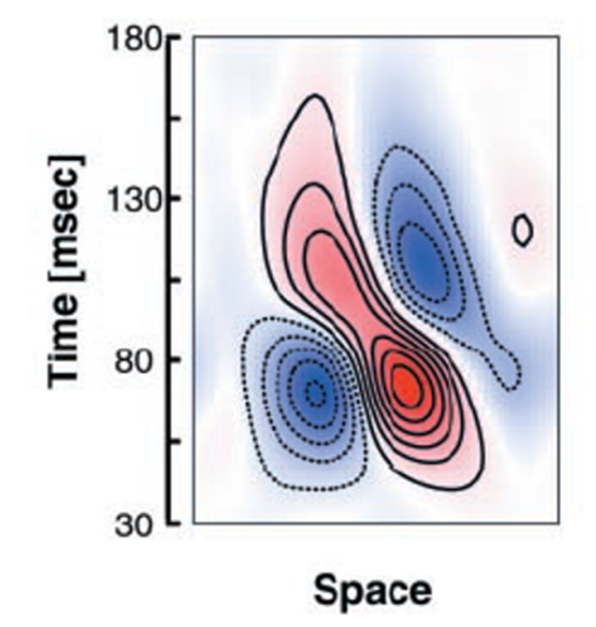
HereisanexampleofwhatIwant-onepolarityofcontourlinesispositiveandtheotherpolarityisnegative.Pleaseadvise.