Get Fresh County By County data
Get Fresh County By County data
In[]:=
AbsoluteTiming[timeseries=ResourceFunction["NYTimesCOVID19Data"]["USCountiesTimeSeries"];]
Out[]=
{56.3167,Null}
Code for making exponential rate lines (sort of hacky):
Code for making exponential rate lines (sort of hacky):
This is pretty hacky, Epilog with DateListLogPlot is not easy to use, but I experimentally found some values that look alright.
This is pretty hacky, Epilog with DateListLogPlot is not easy to use, but I experimentally found some values that look alright.
In[]:=
$linedays=20;
In[]:=
$startlinevalue=1.8
Out[]=
1.8
In[]:=
makeline[a_]:=N@{Darker[ColorData["TemperatureMap"][1/2+1/(a/2)],.2],Line[{{Now,$startlinevalue},{Now+Quantity[$linedays,"Days"],$startlinevalue+($linedays/a)}}],Text["Doubles every "<>ToString[a]<>" days",textlocation[a]]}
In[]:=
textlocation[a_]:=If[2^($linedays/a)<100,{Now+Quantity[$linedays,"Days"],$startlinevalue+($linedays/a)},With[{d=First[x/.NSolve[2^(x/a)100.&&x>0,x]]},{Now+Quantity[d-5,"Days"],N@Log[2,100]}]]
Make the plot:
Make the plot:
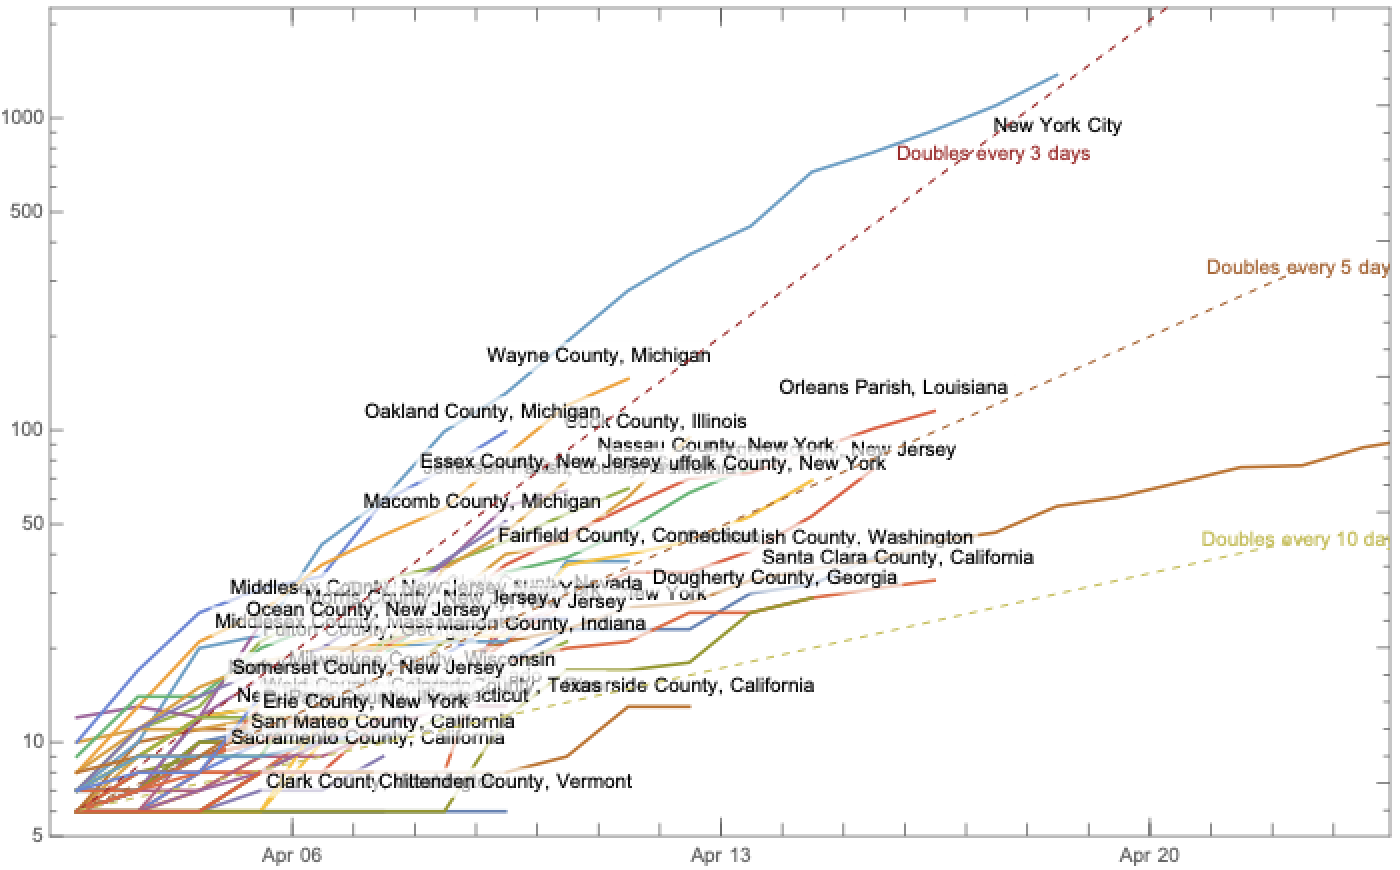
Select counties that have had 5 or more deaths for at least 5 days:
Select counties that have had 5 or more deaths for at least 5 days:
In[]:=
highdeaths=timeseries[All,ResourceFunction["TimeSeriesSelect"][#Deaths,#2>5&]&][Select[#["PathLength"]>5&]/*ResourceFunction["TimeSeriesAlign"]];
DateListLogPlot[highdeaths,FrameTicks{Automatic,Automatic},PlotRange{Automatic,{5,Automatic}},PlotLegendsNone,PlotLabelsPlaced[Automatic,Right,StringDelete[CommonName[#],", United States"]&],Epilog{Dashed,makeline/@{3,5,10}},ImageSize1400]
Make a web form:
Make a web form:
Importing the data on each submission would be way too slow, but it’s small enough to just store in a cloud object and periodically update:
Importing the data on each submission would be way too slow, but it’s small enough to just store in a cloud object and periodically update:
In[]:=
ByteCount[timeseries]
Out[]=
9952312
In[]:=
co=CloudExport[timeseries,"WXF","COVID19/CountyTimeSeries/data.wxf"]
Out[]=
Precompute the lines:
Precompute the lines:
In[]:=
$lines=makeline/@{3,5,10};
In[]:=
$range={Now,Now+Quantity[$linedays,"Days"]};
Deploy the form (you may want to change the permissions to limit your cloud credit usage):
Deploy the form (you may want to change the permissions to limit your cloud credit usage):
In[]:=
CloudDeploy[FormFunction[{"County"RepeatingElement["USCounty"]},With[{data=Import[co]},With[{selected=data[KeyTake[#County],ResourceFunction["TimeSeriesSelect"][#Deaths,#2>5&]&][Select[#["PathLength"]>2&]/*ResourceFunction["TimeSeriesAlign"]]},If[!MissingQ[selected]&&Length[selected]>0,DateListLogPlot[selected,FrameTicks{None,Automatic},PlotRange{$range,{5,1000}},PlotLegendsNone,PlotLabelsPlaced[Automatic,Right,StringDelete[CommonName[#],", United States"]&],Epilog{Dashed,$lines},ImageSize1400],CloudPut[#County->selected,"COVID19/CountyTimeSeries/lastfailure"];"No data found"]]]&,"CloudCDFElement",AppearanceRules<|"Title""US County COVID-19 Death Timeline","Description""NY Times Data updated: "<>DateString[]|>],"COVID19/CountyTimeSeries/form",Permissions"Public"]
Out[]=
Anytime the results do not contain data, it logs it here:
Anytime the results do not contain data, it logs it here:
In[]:=
CloudGet["COVID19/CountyTimeSeries/lastfailure"]
Out[]=
MissingNotAvailable,Select[#1[PathLength]>2&]/*