InequalityPlot function to solve and plotting inequalities in two variables
InequalityPlot function to solve and plotting inequalities in two variables
Robert Ipanaqué-Chero
Department of mathematics
Universidad Nacional de Piura, PERÚ.
Department of mathematics
Universidad Nacional de Piura, PERÚ.
In[]:=
InequalityPlot[ineq_,{x_Symbol,xmin_,xmax_},{y_Symbol,ymin_,ymax_},opts:OptionsPattern[Join[Options[ContourPlot],Options[RegionPlot],{CurvesColor->RGBColor[1,.4,.2]}]]]:=Module[{le=LogicalExpand[ineq],opencurves,closedcurves,curves},opencurves=Cases[Flatten[{le/.And|Or->List}],lexp_<rexp_|lexp_>rexp_|lexp_<rexp_|lexpr_>rexp_:>{lexp==rexp,Dashing[Medium]}];closedcurves=Cases[Flatten[{le/.And|Or->List}],lexp_<=rexp_|lexp_>=rexp_|lexp_<=rexp_|lexp_>=rexp_:>{lexp==rexp,Dashing[None]}];curves=Join[opencurves,closedcurves];Show[RegionPlot[ineq,{x,xmin,xmax},{y,ymin,ymax},BoundaryStyle->None,Evaluate[Sequence@@FilterRules[{opts},Options[RegionPlot]]]],ContourPlot[First[#]//Evaluate,{x,xmin,xmax},{y,ymin,ymax},ContourStyle->Directive[OptionValue[CurvesColor],Last[#]],Evaluate[Sequence@@FilterRules[{opts},Options[ContourPlot]]]]&/@curves]]
In[]:=
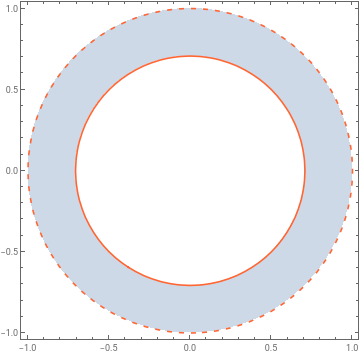
InequalityPlot[0.5<=x^2+y^2<1,{x,-1,1},{y,-1,1}]
Out[]=
In[]:=
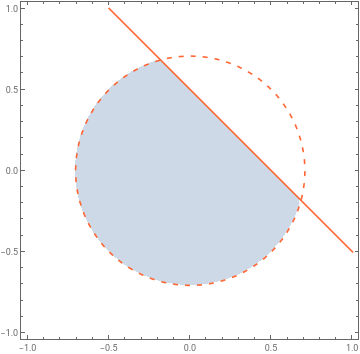
InequalityPlot[x^2+y^2<0.5&&x+y<=0.5,{x,-1,1},{y,-1,1}]
Out[]=