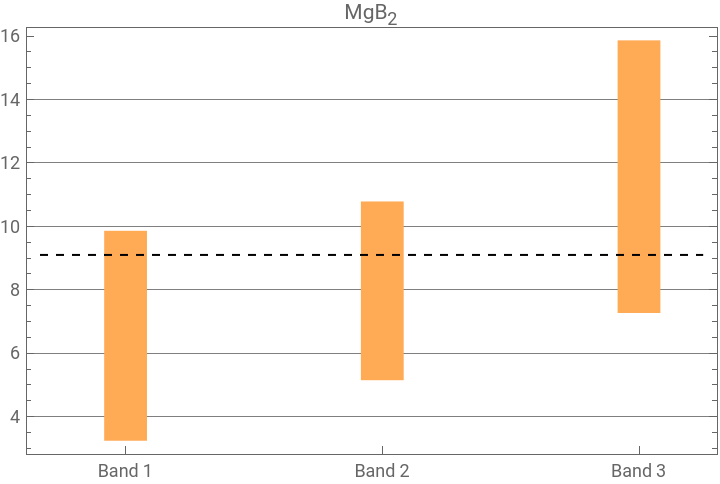
This is a call for collaboration to handle Quantum Espresso data in the form of a “bxsf” file and to draw related figures such as energy range of each band and Fermi surfaces. See below.
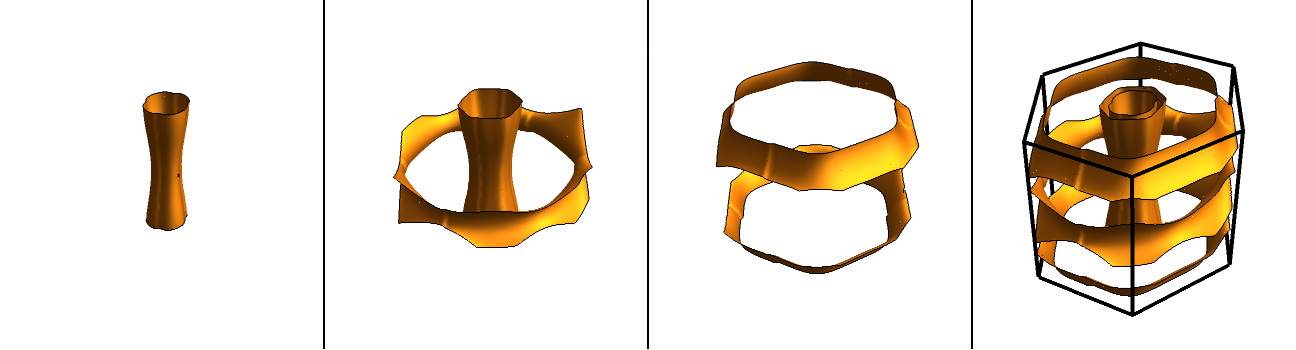
Each Fermi surface and combined image featuring the unit cell.
Initial Aim
Initial Aim
Aim of this project is to create a free and open source (e.g. GPLv3) Wolfram Language package to handle “bxsf” files. The goal at the moment is to:
1
.Draw plots of energy ranges of bands.
2
.Plot all the Fermi surfaces.
Later on we can consider other types of plots.
The Project
The Project
Here I list some preliminary TODO points:
◼
A full parser for “bxsf” files.
◼
Augmenting the energy data. (In some cases only a portion of energy values are provided in the k-space and the full data is to be constructed by symmetry operations like translation.)
◼
Determining the lattice structure. A list of possible types and their formats are listed in the following Quantum Espresso.
◼
Expressing the full “bxsf” data (as an association.)
◼
Drawing the boundaries of the unit cell.
◼
Fourier interpolation of data. (At the moment I am just using the “Interpolation[]” function).
◼
Exporting the Fermi surface data, for other processes like 3D printing.
◼
Automating the whole process and providing intuitive functions.
Collaboration
Collaboration
I am not a solid state physicist myself and I am open to collaboration requests. If you would like to collaborate on this project, please email f.semih.dundar@gmail.com including a short bio. I would be happy to hear from you!