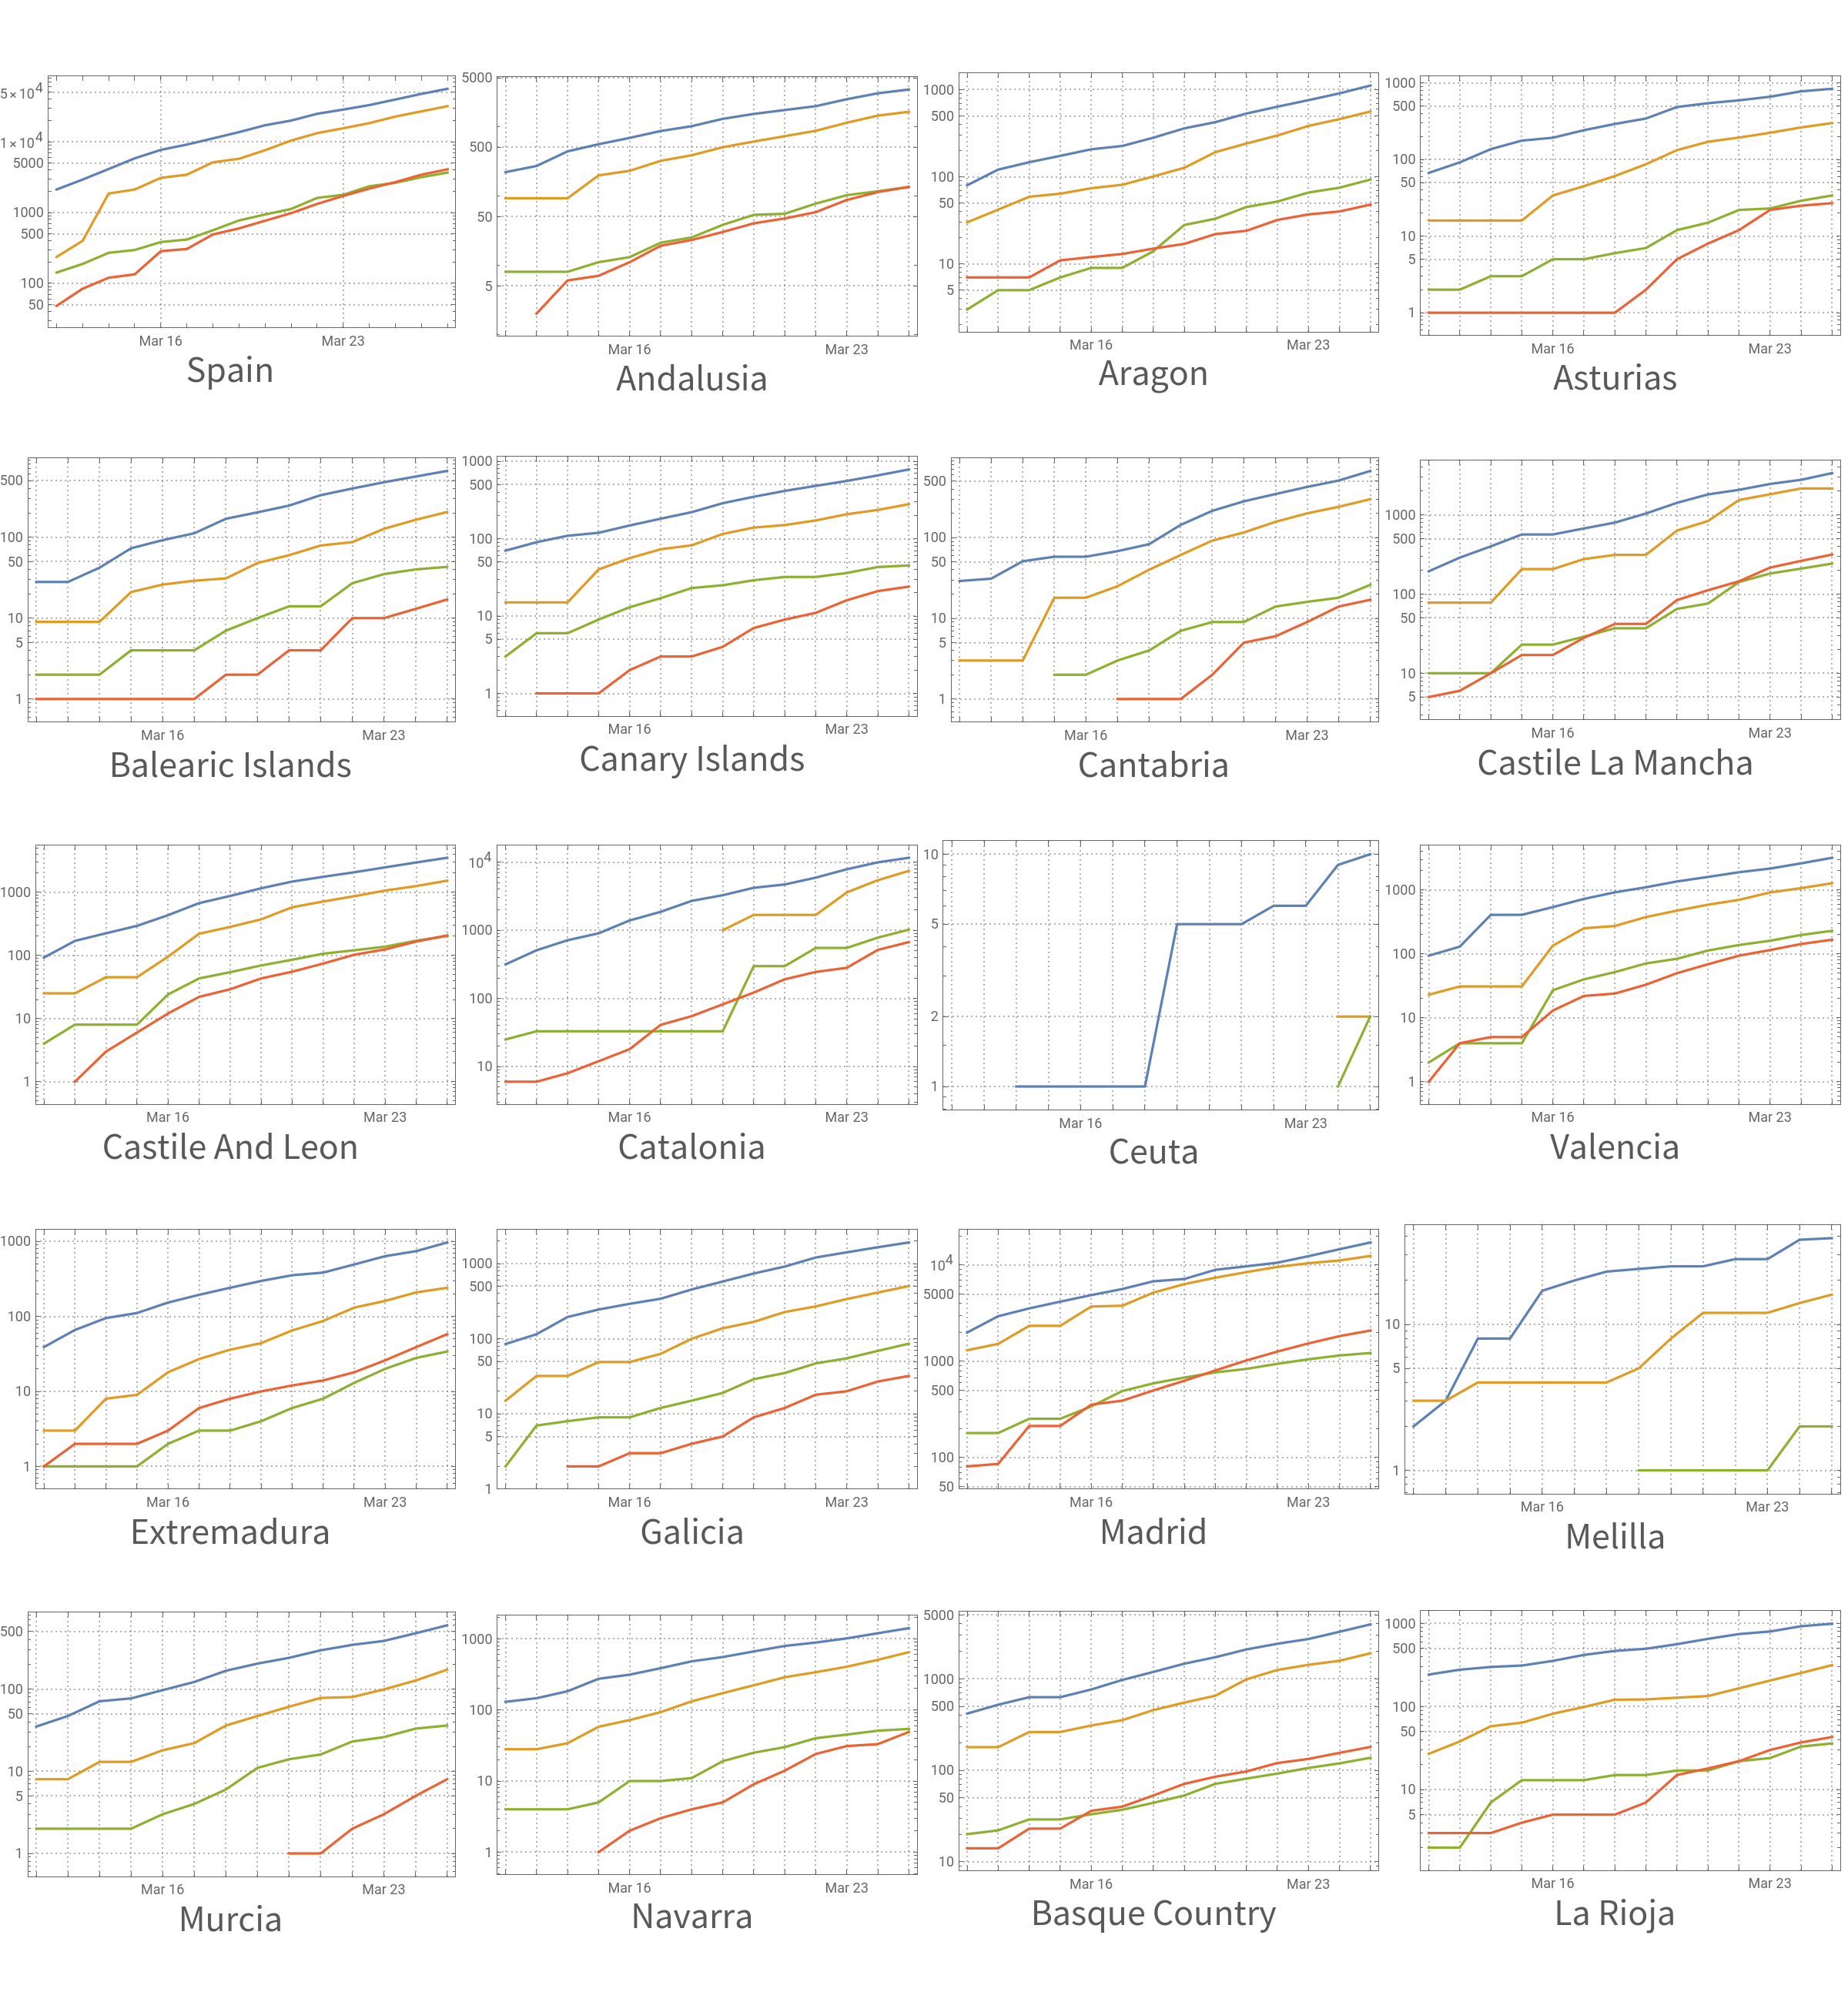
DateListLogPlot and GeoBubbleChart of COVID-19 cases for each administrative division in Spain
I created this notebook to plot the number of COVID-19 cases reported daily by the Spanish Ministry of Health: covid19.isciii.es
In[]:=
raw=Import["https://covid19.isciii.es/resources/serie_historica_acumulados.csv"];
CSV header:
In[]:=
raw[[1]]
Out[]=
{CCAA Codigo ISO,Fecha,Casos,Hospitalizados,UCI,Fallecidos}
There are 19 administrative regions including Catalonia:
In[]:=
ccaa=raw[[2;;20,1]]
Out[]=
{AN,AR,AS,IB,CN,CB,CM,CL,CT,CE,VC,EX,GA,MD,ME,MC,NC,PV,RI}
In[]:=
names={"AN""Andalusia","AR""Aragon","AS""Asturias","IB""Balearic Islands","CN""Canary Islands","CB""Cantabria","CM""Castile La Mancha","CL""Castile And Leon","CT""Catalonia","CE""Ceuta","VC""Valencia","EX""Extremadura","GA""Galicia","MD""Madrid","ME""Melilla","MC""Murcia","NC""Navarra","PV""Basque Country","RI""La Rioja"};
In[]:=
divisions="AN","AR","AS","IB","CN","CB","CM","CL","CT","CE","VC","EX","GA","MD","ME","MC","NC","PV","RI";
In[]:=
dates=DateObject[{#,{"Day","Month","Year"}}]&/@raw[[2;;-2;;19,2]]
Out[]=
,,,,,,,,,,,,,,,,,,,,,,,,,,,,,,,,,,
Time series and Spain’s total cases:
In[]:=
series=Transpose/@Transpose[Partition[raw[[2;;-2,3;;]],19]];totals=Replace[Total[Transpose/@Transpose[Partition[raw[[2;;-2,3;;]],19]]],""0,All];
DateListLogPlot from March 10
DateListLogPlot from March 10
In[]:=
LabeledGraphicsGrid[Partition[Prepend[MapIndexed[Labeled[DateListLogPlot[#1,{{2020,3,12},Automatic,"Day"},GridLines{dates[[22;;]],Automatic},PlotTheme"Detailed",ImageSize300],Style[names[[First[#2],2]],"Subtitle"],Bottom]&,series[[All,All,22;;]]],Labeled[DateListLogPlot[totals[[All,20;;]],{{2020,3,12},Automatic,"Day"},PlotTheme"Detailed",ImageSize300],Style["Spain","Subtitle"],Bottom]],4],ImageSize1200,Spacings{0,-60}],ColumnStyle["COVID-19 cases for each administrative division in Spain (14 days)","Subtitle"],StyleRowRasterizeGraphics,Thickness[.1],Line[{{0,0},{.2,0}}],PlotRange{Automatic,{-.1,.1}},ImageSize30," Cases ", RasterizeGraphics,Thickness[.1],Line[{{0,0},{.2,0}}],PlotRange{Automatic,{-.1,.1}},ImageSize30, " Hospitalized ", RasterizeGraphics,Thickness[.1],Line[{{0,0},{.2,0}}],PlotRange{Automatic,{-.1,.1}},ImageSize30, " Critical ",RasterizeGraphics,Thickness[.1],Line[{{0,0},{.2,0}}],PlotRange{Automatic,{-.1,.1}},ImageSize30," Deaths",18,"Subtitle",AlignmentCenter,Style["DateListLogPlots Powered by WOLFRAM Infographic by @bernatree Data Source: covid19.isciii.es","Subtitle",18],{Top,Bottom}


Out[]=
| ||


GeoBubbleChart
GeoBubbleChart
Iberian Peninsula Map (excluding Canary Islands, Ceuta and Melilla)
Iberian Peninsula Map (excluding Canary Islands, Ceuta and Melilla)
Canary Island:
Canary Island:
Joining both maps: coronaMap[nday_]
Joining both maps: coronaMap[nday_]