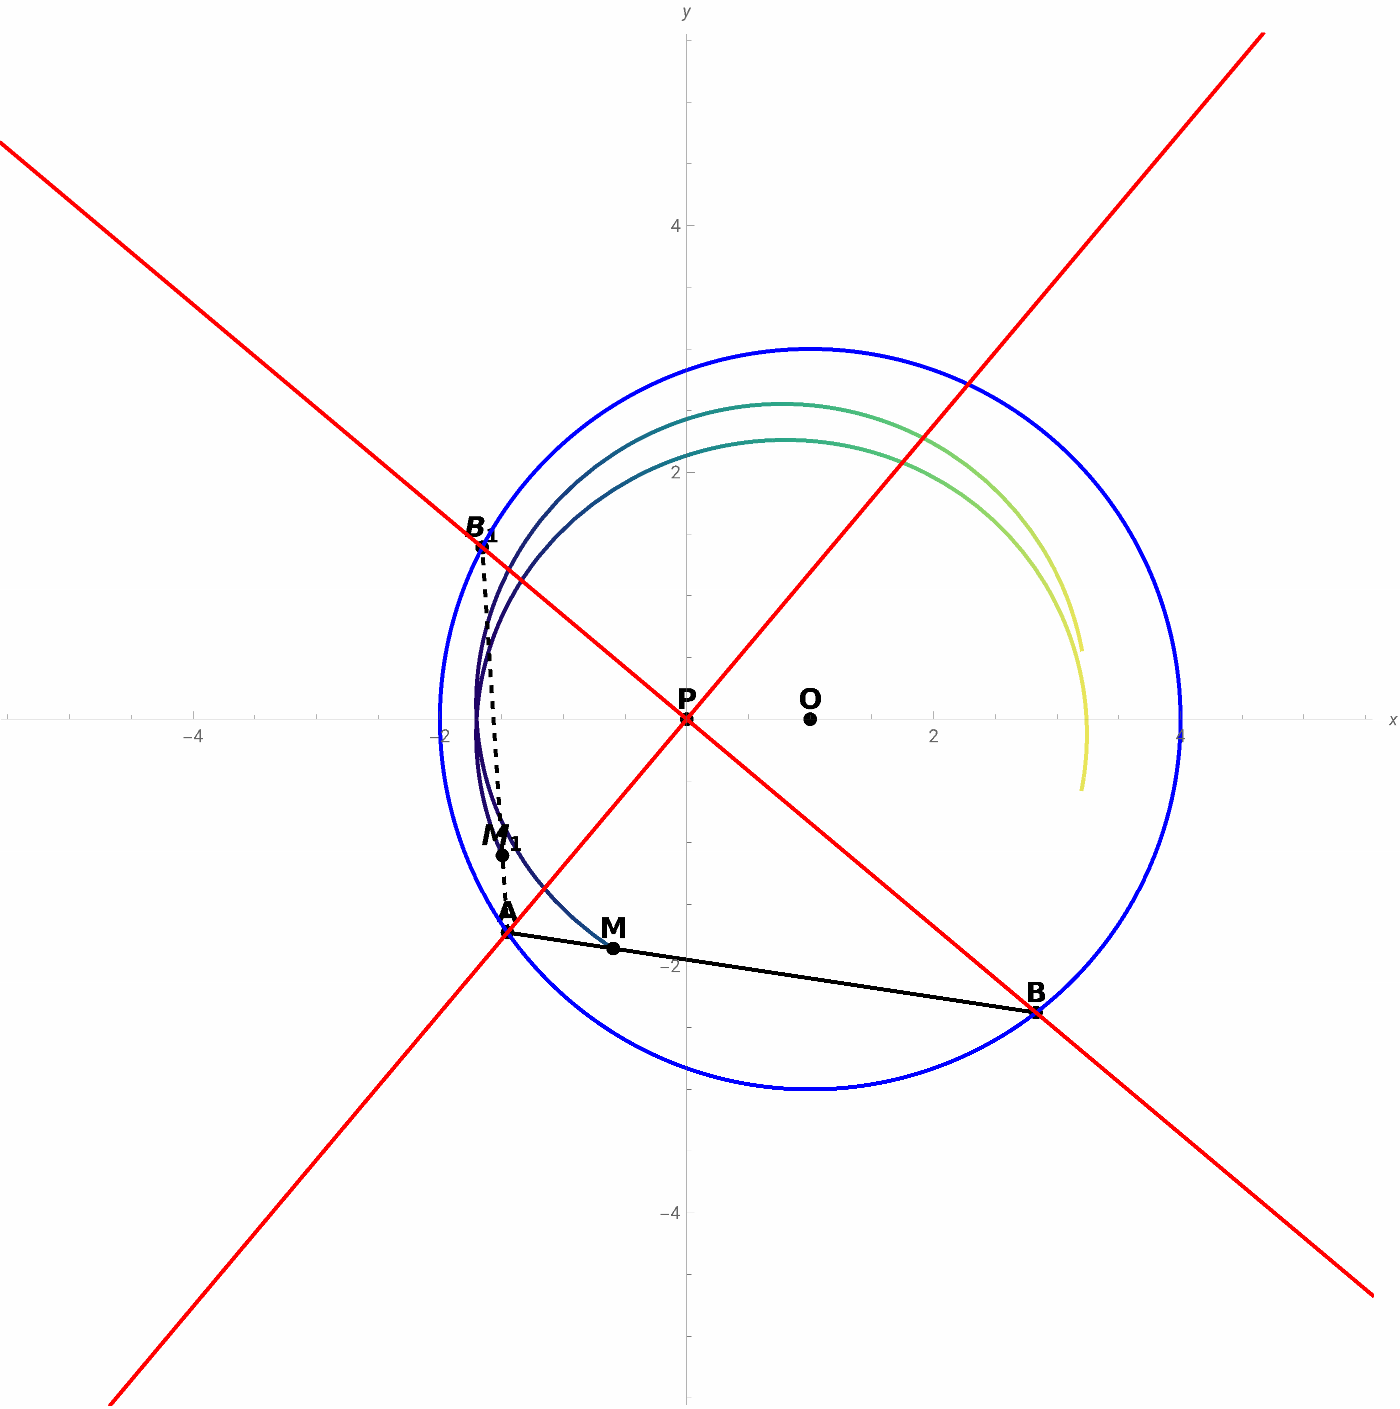
MpointHypotenuse::usage="Let C be a circle with a center in O and radius R, and a P a point inside C. Two perpendicular lines are drawn PA and PB that pass through P, where A and B are the points of intersection of said lines with the circle C. Find the geometric locus of the M that divides the AB side into a given rate r, when it turns.References: Carrillo Hoyo, Ángel et al. Lugares Geométricos. Instituto de Matemáticas, Facultad de Ciencias, UNAM; Personal."
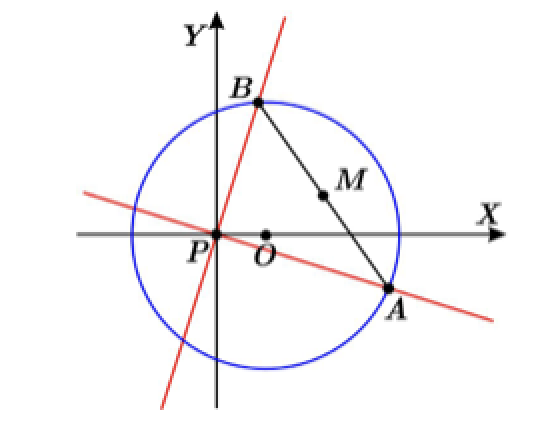
Development:
Calculations for point B:
P={0,0};O={a,0};A={RCos[θ]+a,RSin[θ]};Solvey==-x,+==,{x,y}//FullSimplify
RCos[θ]+a
RSin[θ]
2
(x-a)
2
y
2
R
x2a-(-2++2-aR(4(a-R)(a+R)Cos[θ]+aRCos[2θ])),y,x++2aRCos[θ],y-;
1
2(++2aRCos[θ])
2
a
2
R
2
R
2
2
R
4
a
2
a
2
R
4
R
2
Csc[θ]
2
Sin[θ]
(a+RCos[θ])-a+-2++2-aR(4(a-R)(a+R)Cos[θ]+aRCos[2θ])Sin[θ]
2
R
2
R
4
a
2
a
2
R
4
R
2
Csc[θ]
2
R(++2aRCos[θ])
2
a
2
R
a+-2++2-aR(4(a-R)(a+R)Cos[θ]+aRCos[2θ])
2
R
2
R
4
a
2
a
2
R
4
R
2
Csc[θ]
2
2
Sin[θ]
2
a
2
R
(a+RCos[θ])a+-2++2-aR(4(a-R)(a+R)Cos[θ]+aRCos[2θ])Sin[θ]
2
R
2
R
4
a
2
a
2
R
4
R
2
Csc[θ]
2
R(++2aRCos[θ])
2
a
2
R
Animation:
The coordinates of the B and M points are in the animation.
For the animation it is considered R = 3 and a = 1:
In[]:=
ManipulateR=3;a=1;P={0,0};O1={1,0};xA[θ_]:=N[RCos[θ]+a];yA[θ_]:=N[RSin[θ]];A[θ_]:={xA[θ],yA[θ]};xB[θ_]:=N++2aRCos[θ];yB[θ_]:=N-;xB1[θ_]:=N2a-(-2++2-aR(4(a-R)(a+R)Cos[θ]+aRCos[2θ]));yB1[θ_]:=N;B[θ_]:={xB[θ],yB[θ]};B1[θ_]:={xB1[θ],yB1[θ]};M[θ_]:=,;M1[θ_]:=,;r=;Show[{ParametricPlot[M[θ],{θ,0,θ1},ColorFunction->"BlueGreenYellow",PerformanceGoal->"Quality"],ParametricPlot[M1[θ],{θ,0,θ1},ColorFunction->"BlueGreenYellow",PerformanceGoal->"Quality"],Graphics[{Black,PointSize[0.010],Point[P],Text[Style["P",14,Bold],P,{0,-1.2}],Point[O1],Text[Style["O",14,Bold],O1,{0,-1.2}],Point[A[θ1]],Text[Style["A",14,Bold],A[θ1],{0,-1.2}],Point[B[θ1]],Text[Style["B",14,Bold],B[θ1],{0,-1.2}],Point[B1[θ1]],Text[Style["",14,Bold],B1[θ1],{0,-1.2}],Point[M[θ1]],Text[Style["M",14,Bold],M[θ1],{0,-1.2}],Point[M1[θ1]],Text[Style["",14,Bold],M1[θ1],{0,-1.2}],Thick,{Line[{A[θ1],B[θ1]}],Dashed,Line[{A[θ1],B1[θ1]}]},Blue,Circle[O1,R],Red,InfiniteLine[{P,B[θ1]}],InfiniteLine[{P,A[θ1]}]}]},AspectRatioAutomatic,AxesTrue,AxesOrigin{0,0},AxesLabel{x,y},PlotRange{{-5,5},{-5,5}},ImageSize700],Style["Geometric locus of M",Bold,Large],{{θ1,0.00002,"Value (θ)"},0.00001,2π,0.00001},Delimiter,{{n,1,"Value (n)"},1,10,1},ControlPlacementTop
a+-2++2-aR(4(a-R)(a+R)Cos[θ]+aRCos[2θ])
2
R
2
R
4
a
2
a
2
R
4
R
2
Csc[θ]
2
2
Sin[θ]
2
a
2
R
(a+RCos[θ])a+-2++2-aR(4(a-R)(a+R)Cos[θ]+aRCos[2θ])Sin[θ]
2
R
2
R
4
a
2
a
2
R
4
R
2
Csc[θ]
2
R(++2aRCos[θ])
2
a
2
R
1
2(++2aRCos[θ])
2
a
2
R
2
R
2
2
R
4
a
2
a
2
R
4
R
2
Csc[θ]
2
Sin[θ]
(a+RCos[θ])-a+-2++2-aR(4(a-R)(a+R)Cos[θ]+aRCos[2θ])Sin[θ]
2
R
2
R
4
a
2
a
2
R
4
R
2
Csc[θ]
2
R(++2aRCos[θ])
2
a
2
R
xA[θ]+rxB[θ]
1+r
yA[θ]+ryB[θ]
1+r
xA[θ]+rxB1[θ]
1+r
yA[θ]+ryB1[θ]
1+r
1
n
B
1
M
1
Out[]=