Reading a Psychrometric Chart
Reading a Psychrometric Chart


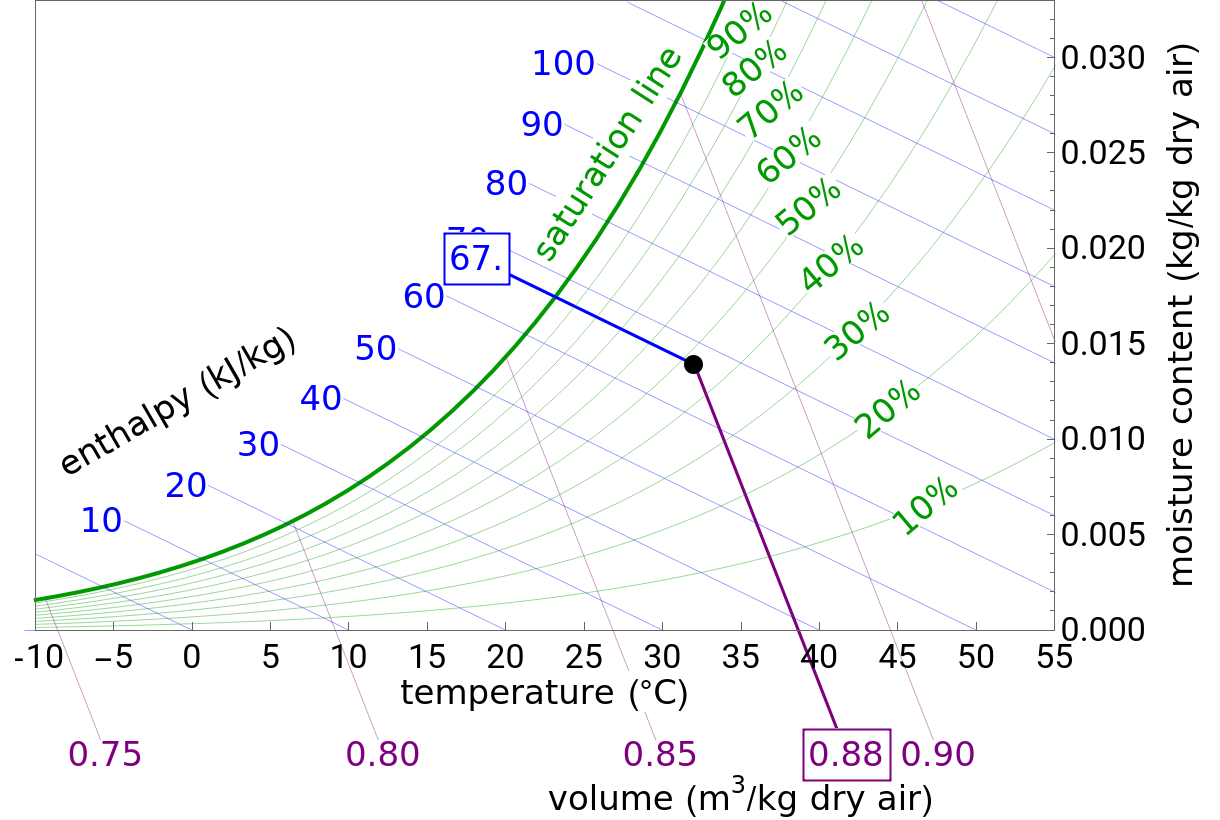
This Demonstration shows how to read a psychrometric chart (also known as a humidity chart). Select the relative humidity (green curves) and the dry-bulb temperature ( axis) using sliders. Unchecking the "relative humidity" box removes the labels for the relative-humidity lines. Check the boxes for "enthalpy" (blue) and "specific volume" (purple) to display lines of constant enthalpy and constant volume, respectively. Check the box for "temperatures" to display dashed black lines that point to dry-bulb, wet-bulb and dew point temperatures that correspond to those values at the black dot. When the "temperatures" box is checked, move the mouse over each dashed line to identify which temperature it corresponds to. All temperatures are read on the axis. Check "display values" to see a table of the values obtained from the chart for the selected point; only the moisture content and the values whose boxes are checked are displayed. The values per kg are per kg of dry air.
x
x
Details
Details
Relative humidity is defined by:
ϕ=100
P
sat
P
where is the pressure and is the saturation pressure (bar).
P
sat
P
The saturation pressure is calculated from the Antoine equation:
sat
P
B
T+C
where , and are Antoine constants and is temperature (°C).
A
B
C
T
The screencast video at[1] explains how to use this Demonstration. For an example problem that uses this Demonstration, view the screencast at[2]. For additional resources on the psychrometric chart, view the screencasts at[3–5].
References
References
[1] Reading a Psychrometric Chart[Video]. (Dec 8, 2016) www.colorado.edu/learncheme/thermodynamics/ReadingPsychrometricChart.html.
[3] Psychrometric Charts (Humidity Charts)[Video]. (Dec 8, 2016) www.youtube.com/watch?v=WU5J6XdG_TM.
[5] Humidity Chart: Adiabatic Humidification[Video]. (Dec 8, 2016) www.youtube.com/watch?v=1oMwioiEl-Q.
External Links
External Links
Permanent Citation
Permanent Citation
Rachael L. Baumann, John L. Falconer
"Reading a Psychrometric Chart"
http://demonstrations.wolfram.com/ReadingAPsychrometricChart/
Wolfram Demonstrations Project
Published: July 17, 2015