Liquefaction of N2 by Joule–Thomson Throttling
Housam Binous and Ahmed Bellagi
Liquefaction of N2 by Joule–Thomson Throttling
Housam Binous and Ahmed Bellagi
Housam Binous and Ahmed Bellagi
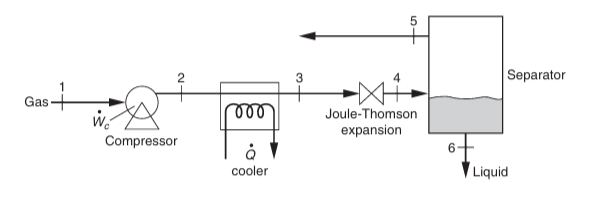
This problem is reproduced from Example 5-10 of Ref. 1.Consider the liquefaction of N2 by Joule–Thomson throttling. If the inlet to the expansion valve is at T3 = -122°C and P3 = 100 bar and the outlet is at P5=P6=1 bar. We determine the percentage of N2 that is liquefied.References:[1] Milo D. Koretsky, Engineering and Chemical Thermodynamics, NY: Wiley, 2013.
Thermophysical Properties of Nitrogen from: https://webbook.nist.gov/cgi/fluid.cgi?ID=C7727379&Action=Page
saturation properties - temperature increment = 5 °C
Temperature (°C), Pressure (bar), Enthalpy (kJ/kg), Entropy (J/g*K), Enthalpy (kJ/kg), Entropy (J/g*K)
Temperature (°C), Pressure (bar), Enthalpy (kJ/kg), Entropy (J/g*K), Enthalpy (kJ/kg), Entropy (J/g*K)
In[]:=
datasat={{-210.00,0.12520,-462.15,-5.5162,-246.64,-2.1035},{-205.00,0.29159,-452.12,-5.3636,-241.97,-2.2800},{-200.00,0.59850,-442.01,-5.2210,-237.62,-2.4268},{-195.00,1.1118,-431.80,-5.0869,-233.66,-2.5515},{-190.00,1.9069,-421.45,-4.9597,-230.20,-2.6597},{-185.00,3.0663,-410.90,-4.8383,-227.33,-2.7559},{-180.00,4.6771,-400.08,-4.7213,-225.18,-2.8437},{-175.00,6.8303,-388.89,-4.6074,-223.88,-2.9263},{-170.00,9.6204,-377.18,-4.4952,-223.63,-3.0066},{-165.00,13.147,-364.75,-4.3826,-224.74,-3.0880},{-160.00,17.517,-351.22,-4.2668,-227.73,-3.1754},{-155.00,22.855,-335.81,-4.1417,-233.74,-3.2778},{-150.00,29.331,-316.02,-3.9883,-246.41,-3.4231}};
In[]:=
tblhl=Table[{datasat[[i]][[2]],datasat[[i]][[3]]},{i,1,Length[datasat]}];tblsl=Table[{datasat[[i]][[2]],datasat[[i]][[4]]},{i,1,Length[datasat]}];
In[]:=
fhl=Interpolation[tblhl];fsl=Interpolation[tblsl];
In[]:=
tblhv=Table[{datasat[[i]][[2]],datasat[[i]][[5]]},{i,1,Length[datasat]}];tblsv=Table[{datasat[[i]][[2]],datasat[[i]][[6]]},{i,1,Length[datasat]}];
In[]:=
fhv=Interpolation[tblhv];fsv=Interpolation[tblsv];
In[]:=
tbltp=Table[{datasat[[i]][[2]],datasat[[i]][[1]]},{i,1,Length[datasat]}];
In[]:=
fpt=Interpolation[tbltp];
In[]:=
H6l=fhl[1]
Out[]=
-434.658
In[]:=
H5v=fhv[1]
Out[]=
-234.861
isobaric properties - pressure = 100 bar
{Temperature (°C), Pressure (bar), Enthalpy (kJ/kg), Entropy (kJ/kg*K), State)}
{Temperature (°C), Pressure (bar), Enthalpy (kJ/kg), Entropy (kJ/kg*K), State)}
In[]:=
In[]:=
tblhCOMP=Table[{dataisobaric[[i]][[1]],dataisobaric[[i]][[3]]},{i,1,Length[dataisobaric]}];tblsCOMP=Table[{dataisobaric[[i]][[1]],dataisobaric[[i]][[4]]},{i,1,Length[dataisobaric]}];
In[]:=
fhCOMP=Interpolation[tblhCOMP];fsCOMP=Interpolation[tblsCOMP];
In[]:=
H3=fhCOMP[-122]
Out[]=
-259.614
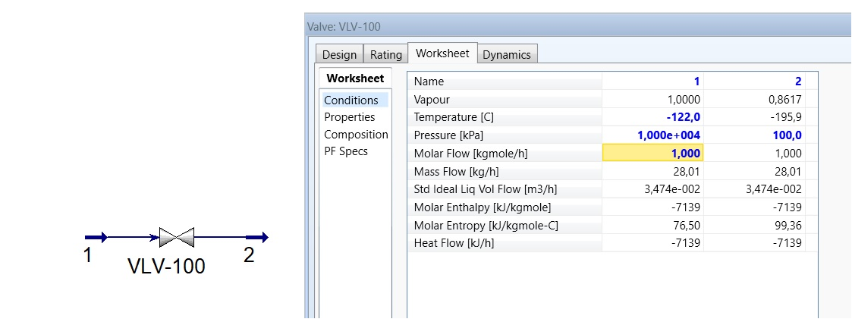
We get the fraction of the nitrogen, which is liquefied = 12.39 % and a temperature T4 = T5 = -196.41 °C.The above values closely matches their counterparts (13.83% and -195.9 °C) obtained using HYSYS and the Peng-Robinson EoS:However, in Ref. 1, the reported result is different (roughly 28% of nitrogen is liquified).
In[]:=
z=(H3−H6l)/(H5v-H6l)
Out[]=
0.876111
In[]:=
1-z
Out[]=
0.123889
In[]:=
fpt[1]
Out[]=
-196.41