Get confirmed cases for USA counties:
In[]:=
DeleteObject[ResourceObject["Epidemic Data for Novel Coronavirus COVID-19","USCounties"]];usa=Normal[ResourceData["Epidemic Data for Novel Coronavirus COVID-19","USCounties"][All,Flatten@{#County,#ConfirmedCases["Values"]}&]];
Get the total cases of USA:
In[]:=
usaTotal=Total[usa〚All,2;;〛];
Counties in Continental US states:
In[]:=
coList=Flatten["Subdivisions"],,;continentalCO=Select[usa,MemberQ[coList,#〚1〛]&];

Counties in Hawaii:
In[]:=
hawaiiCO=Selectusa,MemberQ["Subdivisions"],#1&;
Counties in Alaska
In[]:=
alaskaCO=Selectusa,MemberQ["Subdivisions"],#1&;
Set colors, bins and coloring functions:
In[]:=
colors=Prepend[Table[Blend[ResourceFunction["ColorBrewerData"]["Reds",9],x],{x,0,1,1/20}],White];bins={0,10,20,30,40,50,100,200,400,600,800,1000,1500,2000,3000,4000,5000,10000,20000,30000,50000};cfunc[x_]:=Which@@Riffle[Join[x≤#&/@bins,{x>Last[bins]}],colors]
Generate dates string starting from Jan 22nd:
In[]:=
dates=DateString/@DateRangeDateObject@{2020,1,22},Today,;
Define a function to make a map of the 50 states in the US with Alaska and Hawaii as insets:
In[]:=
geo[m_]:=Module{Hawaii,Alaska,n},n=m+1;Hawaii=GeoGraphics{GeoStyling[FaceForm[cfunc[#2]]],Polygon[#1]}&@@@hawaiiCO[[All,{1,n}]],EdgeForm[LightGray],FaceForm[],Polygon,GeoBackgroundNone;Alaska=GeoGraphics{GeoStyling[{FaceForm[cfunc[#2]]}],Polygon[#1]}&@@@alaskaCO[[All,{1,n}]],EdgeForm[LightGray],FaceForm[],Polygon,GeoBackgroundNone;GeoGraphics{GeoStyling[{FaceForm[cfunc[#2]]}],Polygon[#1]}&@@@continentalCO[[All,{1,n}]],EdgeForm[LightGray],FaceForm[],Polygon,Inset[Alaska,{-0.21,-0.1},{0,0},0.3],Inset[Hawaii,{0.01,-0.12},{0,0},0.2],Inset[Column[{dates〚m〛,"Total cases: "<>ToString[NumberForm[usaTotal〚m〛,DigitBlock->3]]}],{0.27,-0.17},{0,0},0.3],GeoBackgroundNone,GeoProjection{"LambertAzimuthal","Centering"GeoPosition[{30,-195/2}]},FrameTrue,FrameTicksNone,PlotRange{{-0.37,0.38},{-0.2,0.38}}
Make maps of US counties for 100 days:
In[]:=
geoList=Table[geo[i],{i,100}];//AbsoluteTiming
Out[]=
{2817.47,Null}
Rasterize geo maps:
In[]:=
list=Rasterize/@geoList;
Export the list of maps as a GIF:
In[]:=
Export[NotebookDirectory[]<>"animation.gif",list,"DisplayDurations".3,AnimationRepetitions100]
In[]:=
Animate[list[[i]],{i,1,100,1}]
Out[]=
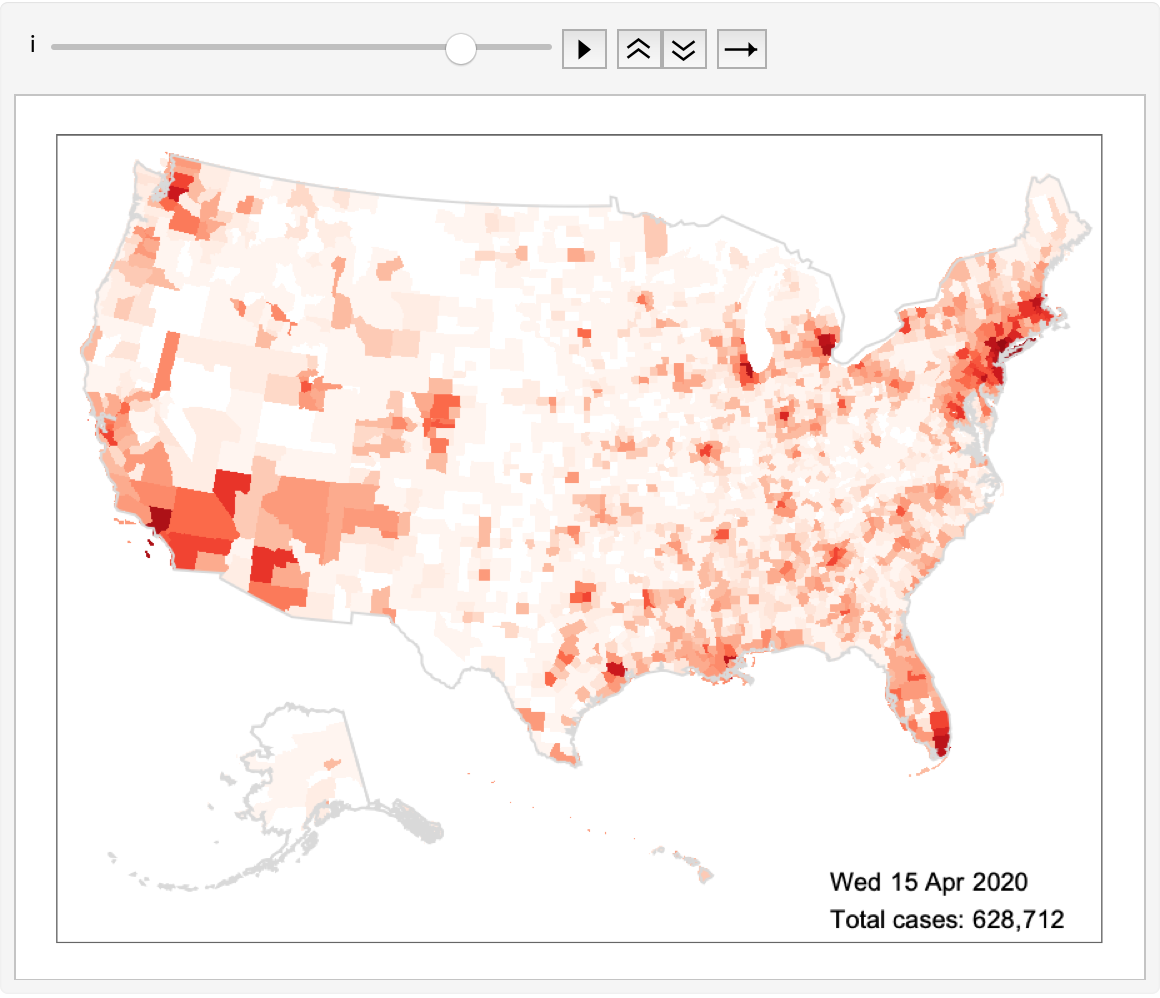
Generate corresponding legend for the colors and their bins:
In[]:=
legend=SwatchLegend[colors,ToString/@Join[{ToString@First[bins]},ToString@(#1+1)<>"-"<>ToString@#2&@@@Partition[bins,2,1],{">"<>ToString@Last[bins]}],LegendMarkersGraphics[{EdgeForm[Black],Opacity[1],Rectangle[]}],LegendLabel"Confirmed Cases",LegendFunction(Framed[#,RoundingRadius5]&),LegendMargins5]
Out[]=


