Exploring the Tails of the Normal Distribution
Exploring the Tails of the Normal Distribution


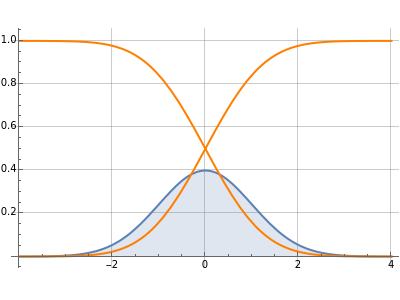
This Demonstration allows you to estimate the area under the tails of the normal distribution curve. Reading the value of the cumulative distribution function (orange curve) for a specific value gives the area under the probability distribution function (blue curve) to the left (for the lower tail) or to the right (upper tail) of the value. The probability distribution function can be adjusted to have values for the mean and standard deviation in the ranges (-10, 10) and (0.1, 15), respectively.
x
x
μ
σ
Details
Details
In the "full distribution" view, the plotted range is set at . This range can be expanded or compressed by using the bottom slider. In the "lower tail" view, the plotted range is set at (, ) to give a view of the tail beyond the typically viewed point. Similarly, for the "upper tail" view, the plotted range is set at (, ). The ranges in these tail views can also be expanded or compressed to home in on the portions of the curves of interest.
±4σ
-6σ
-3σ
3σ
3σ
6σ
External Links
External Links
Permanent Citation
Permanent Citation
Joe O'Hara
"Exploring the Tails of the Normal Distribution"
http://demonstrations.wolfram.com/ExploringTheTailsOfTheNormalDistribution/
Wolfram Demonstrations Project
Published: September 28, 2007