ABSTRACT (original article): Sleep is one of the most noticeable and widespread phenomena occurring in multicellular animals. Nevertheless, no consensus for a theory of its origins has emerged. In particular, no explicit, quantitative theory exists that elucidates or distinguishes between the myriad hypotheses proposed for sleep. Here, we develop a general, quantitative theory for mammalian sleep that relates many of its fundamental parameters to metabolic rate and body size. Several mechanisms suggested for the function of sleep can be placed in this framework, e.g., cellular repair of damage caused by metabolic processes as well as cortical reorganization to process sensory input. Our theory leads to predictions for sleep time, sleep cycle time, and rapid eye movement time as functions of body and brain mass, and it explains, for example, why mice sleep ≈14 hours per day relative to the 3.5 hours per day that elephants sleep. Data for 96 species of mammals, spanning six orders of magnitude in body size, are consistent with these predictions and provide strong evidence that time scales for sleep are set by the brain’s, not the whole-body, metabolic rate. CITATION (original article): V.M. Savage,& G.B. West (2007), A quantitative, theoretical framework for understanding mammalian sleep, Proc. Natl. Acad. Sci. U.S.A. 104 (3) 1051-1056, https://doi.org/10.1073/pnas.0610080104
We present a quantitative framework linking mammalian sleep patterns to brain metabolic rate via allometric scaling laws. Empirical data across 96 species reveal sleep-awake ratios scale with brain mass as , prioritizing neuronal repair over whole-body processes. Sleep cycle durations align with , reflecting oscillations between REM and non-REM phases for reorganization/repair. REM fraction remains invariant (~17%), underscoring universal neural maintenance. Regression analyses and 95% confidence intervals validate brain-driven dynamics, rejecting body-mass-centric models.
-1/4
M
b
0.16-0.23
M
Allometric scaling of sleep-sake ratio
Allometric scaling of sleep-sake ratio
Loading the dataset from sleepawakeratio.txt, containing pairs of values for the natural logarithm of body mass (ln(M)) in kilograms and the natural logarithm of the ratio of total sleep time to awake time (ln(tS/tA)). The dataset spans 83 mammalian taxa (representing 96 species and 79 genera), covering six orders of magnitude in body size (e.g., mice to elephants). These data directly test the theoretical prediction that the sleep-to-awake time ratio scales with body mass as ∝, reflecting brain metabolic rate dominance over whole-body repair processes. The values align with the paper’s analysis of interspecific variation in sleep behavior, where smaller mammals exhibit higher sleep-to-awake ratios due to proportionally higher brain metabolic rates.
t
S
t
A
-1/4
M
In[]:=
y=;
In[]:=
Length[y]
Out[]=
83
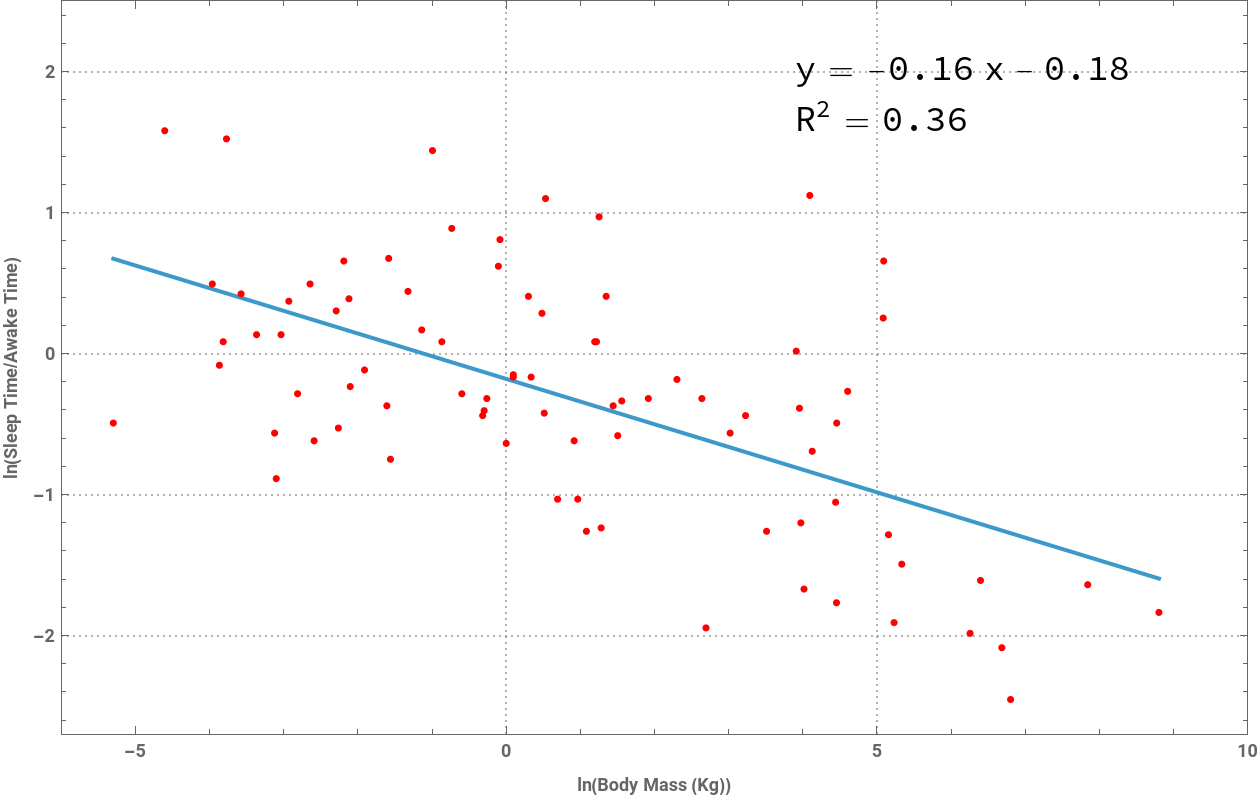
This line performs an Ordinary Least Squares (OLS) regression to fit a linear model between ln(tS/tA) and ln(M). According to the paper’s theoretical framework, if brain metabolic rate governs sleep regulation, the slope of this relationship should approximate –1/4 (–0.25) . The fitted model yields a slope of –0.161 (intercept = –0.18), closely matching the empirically observed slope of –0.16 (95% CI: –0.21 to –0.11) in Figure 1 of the paper. This supports the hypothesis that sleep dynamics are governed by brain metabolism rather than whole-body metabolic rate, which would predict a steeper slope of –0.25 . The result also aligns with the predicted range of –1/6 to –3/16 (–0.16 to –0.19) derived from brain-specific metabolic scaling exponents.
In[]:=
aa=LinearModelFit[y,x,x]
Out[]=
FittedModel
Parameter Table : The slope estimate (–0.161) has a small standard error (0.024) and a highly significant p -value , confirming a strong negative relationship between ln(tS/tA) and ln(M).
Confidence Interval Table : The 95% confidence interval for the slope (–0.209 to –0.113) brackets the theoretically predicted range of –1/6 to –3/16 (–0.16 to –0.19) for brain-driven processes but excludes the –1/4 (–0.25) prediction for whole-body repair.
ANOVA Table : The model explains ~35.5% of the variance with an F -statistic of 44.68 (p≈0.000000003), demonstrating robust statistical significance despite biological variability (e.g., ecological factors like predation or diet). These results mirror the paper’s conclusion that brain metabolic rate, not whole-body metabolism, dominates sleep regulation.
(2.7)
-9
x10
Confidence Interval Table : The 95% confidence interval for the slope (–0.209 to –0.113) brackets the theoretically predicted range of –1/6 to –3/16 (–0.16 to –0.19) for brain-driven processes but excludes the –1/4 (–0.25) prediction for whole-body repair.
ANOVA Table : The model explains ~35.5% of the variance
(=0.355)
2
R
In[]:=
aa[{"ParameterTable","ParameterConfidenceIntervalTable","ANOVA"}]//Column
| ||||||||||||||||||||||||||
| ||||||||||||||||||||||||||
This line visualizes the best-fit regression line (best-fit model: ) alongside the original data points. The x-axis corresponds to ln(M) (body mass in kg), while the y-axis represents . The coefficient of determination indicates moderate explanatory power, consistent with Figure 1 in the paper, which highlights scatter due to ecological and phylogenetic constraints. The negative slope (–0.161) confirms the theoretical prediction that smaller mammals (e.g., rodents) require disproportionately more sleep relative to awake time compared to larger mammals (e.g., elephants). This visualization underscores the paper’s core finding: sleep time scaling reflects brain-specific metabolic demands rather than whole-body physiology.
y=−0.18−0.161x
ln(/)
t
S
t
A
(=0.355)
2
R
In[]:=
Plotaa["BestFit"],{x,Sequence@@MinMax[y[[All,1]]]},Epilog->{Red,PointSize[.006],Point[y]},
Out[]=
Brain mass scaling of sleep-wake ratio
Brain mass scaling of sleep-wake ratio
Loading the dataset from brainsleep.txt, which contains pairs of values for the natural logarithm of brain mass (ln(Mb)) in grams and the natural logarithm of the ratio of total sleep time to awake time . The dataset spans 56 mammalian species (as indicated by Length[y] = 56), representing genera such as rodents, carnivores, and primates. These data align with the paper’s focus on testing whether brain metabolic rate governs sleep regulation. By analyzing against ln(Mb), this step tests the theoretical prediction that the sleep-to-awake time ratio scales with brain mass as ∝, reflecting brain-driven repair or reorganization processes.
ln(/)
t
S
t
A
ln(/)
t
S
t
A
t
S
t
A
-1/4
M
b
In[]:=
y=;
In[]:=
Length[y]
Out[]=
56
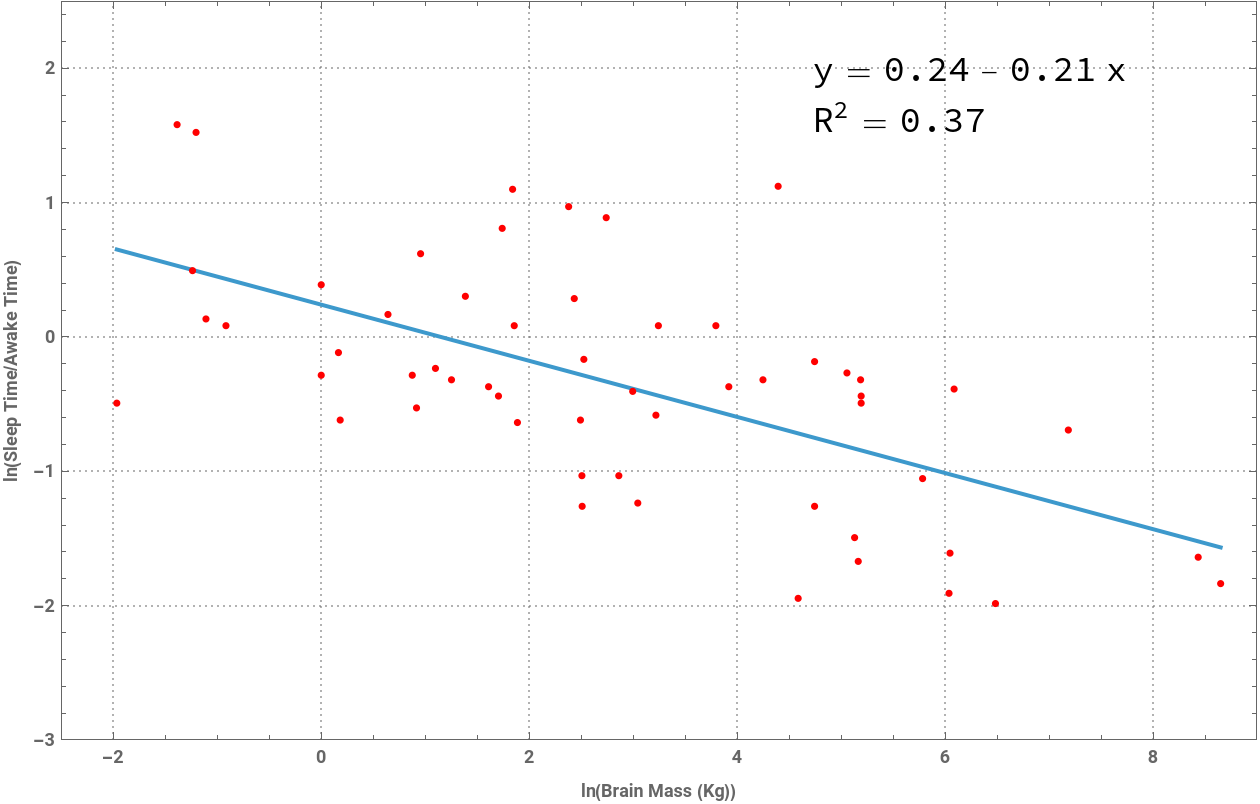
This line performs an Ordinary Least Squares (OLS) regression to fit a linear model between ln(tS/tA) and ln(Mb). According to the paper’s framework, if brain metabolic rate determines sleep patterns, the slope of this relationship should approximate –1/4 (–0.25). The result here yields a slope of –0.209 (with an intercept of 0.24), closely matching the empirically observed slope of –0.21 in Figure 2 of the paper. This supports the hypothesis that sleep dynamics are governed by brain metabolism rather than whole-body metabolic rate, which would predict a steeper slope of –1/4 (–0.25).
In[]:=
aa=LinearModelFit[y,x,x]
Out[]=
FittedModel
Parameter Table : The slope estimate (–0.208856) has a small standard error (0.0368) and a highly significant p -value , confirming a strong negative relationship between ln(tS/tA) and ln(Mb).
Confidence Interval Table : The 95% confidence interval for the slope (–0.283 to –0.135) brackets the theoretically predicted –1/4 (–0.25), validating the brain metabolic rate hypothesis.
ANOVA Table : The model explains ~37% of the variance (=0.373) with an F -statistic of 32.2 (p ≈ 0.00000056), demonstrating robust statistical significance despite biological variability. These results mirror the paper’s findings, where brain mass was shown to dominate sleep regulation over body mass.
(5.64×)
-7
10
Confidence Interval Table : The 95% confidence interval for the slope (–0.283 to –0.135) brackets the theoretically predicted –1/4 (–0.25), validating the brain metabolic rate hypothesis.
ANOVA Table : The model explains ~37% of the variance (
2
R
In[]:=
aa[{"ParameterTable","ParameterConfidenceIntervalTable","ANOVA"}]//Column
| ||||||||||||||||||||||||||
| ||||||||||||||||||||||||||
This line visualizes the regression line (best-fit model: y=0.24−0.209x) alongside the original data points. The x-axis represents ln(Mb) (brain mass in grams), and the y-axis corresponds to ln(tS/tA). The plot replicates Figure 2 from the paper, showing a clear negative trend where smaller-brained mammals (e.g., mice) have higher sleep-to-awake ratios compared to larger-brained species (e.g., elephants). The coefficient of determination (=0.373) underscores that while brain mass explains a moderate fraction of sleep variation, ecological factors (e.g., predation, foraging demands) likely contribute to residual scatter. This visualization reinforces the paper’s conclusion that brain metabolic rate, not body mass, sets sleep time scaling.
2
R
In[]:=
Plotaa["BestFit"],{x,Sequence@@MinMax[y[[All,1]]]},Epilog->{Red,PointSize[.006],Point[y]},
Out[]=
Sleep cycle timing
Sleep cycle timing
Loading the dataset from sleepcycletime.txt, containing pairs of values for the natural logarithm of body mass (ln(M)) in kilograms and the natural logarithm of sleep cycle time (ln(tC)) in minutes. The dataset spans 32 mammalian species , covering five orders of magnitude in body size (e.g., rodents to large mammals like elephants). These data align with the paper’s analysis of how sleep cycle time—the period between REM sleep phases—scales with body mass. Sleep cycle time is theorized to reflect brain metabolic rate rather than whole-body metabolism, with the prediction ∝. The dataset mirrors the empirical observations used in Figure 3 of the paper, which tests this scaling relationship against theoretical expectations derived from resource distribution networks and brain-specific repair/reorganization processes.
t
C
1/4
M
In[]:=
y=;
In[]:=
Length[y]
Out[]=
32
This line performs an Ordinary Least Squares (OLS) regression to fit a linear model between ln(tC) (sleep cycle time) and ln(M) (body mass). According to the paper’s theoretical framework, if sleep cycles are governed by brain metabolic rate, the scaling exponent for ∝ should fall within the range (corresponding to brain mass scaling exponents to ). The fitted model yields a slope of 0.187 , closely matching the empirically observed slope of 0.19 in the paper’s Figure 3. This supports the hypothesis that sleep cycle timing is driven by brain metabolic constraints rather than whole-body metabolism, which would predict a steeper slope of 0.25 .
t
C
Pb
M
Pb=0.16-0.23
1/6
M
b
3/16
M
b
()
1/4
M
In[]:=
aa=LinearModelFit[y,x,x]
Out[]=
FittedModel
Parameter Table : The slope estimate (0.187) has a small standard error (0.022) and a highly significant p -value , confirming a robust positive relationship between ln(tC) and ln(M).
Confidence Interval Table : The 95% confidence interval for the slope (0.142 to 0.232) brackets the theoretically predicted range of 0.16–0.23 (for brain-driven processes) but excludes the whole-body metabolic rate prediction of 0.25.
ANOVA Table : The model explains ~70.7% of the variance with an F -statistic of 72.5 (p ≈ 0.000000002), demonstrating strong statistical significance. These results validate the paper’s conclusion that sleep cycle time scales with body mass near the lower end of the brain metabolic rate prediction . reinforcing the dominance of brain-specific mechanisms over whole-body processes.
(1.68)
-9
x10
Confidence Interval Table : The 95% confidence interval for the slope (0.142 to 0.232) brackets the theoretically predicted range of 0.16–0.23 (for brain-driven processes) but excludes the whole-body metabolic rate prediction of 0.25
()
1/4
M
ANOVA Table : The model explains ~70.7% of the variance
(=0.707)
2
R
()
1/6
M
In[]:=
aa[{"ParameterTable","ParameterConfidenceIntervalTable","ANOVA"}]//Column
| ||||||||||||||||||||||||||
| ||||||||||||||||||||||||||
CITE THIS NOTEBOOK
CITE THIS NOTEBOOK
A quantitative, theoretical framework for understanding mammalian sleep
by Van M. Savage and Geoffrey B. West
Wolfram Community, STAFF PICKS, May 1, 2025
https://community.wolfram.com/groups/-/m/t/3462309
by Van M. Savage and Geoffrey B. West
Wolfram Community, STAFF PICKS, May 1, 2025
https://community.wolfram.com/groups/-/m/t/3462309