Ordinary Vapor Compression Cycle
Authors: Housam Binous and Ahmed Bellagi
Ordinary Vapor Compression Cycle
Authors: Housam Binous and Ahmed Bellagi
Authors: Housam Binous and Ahmed Bellagi
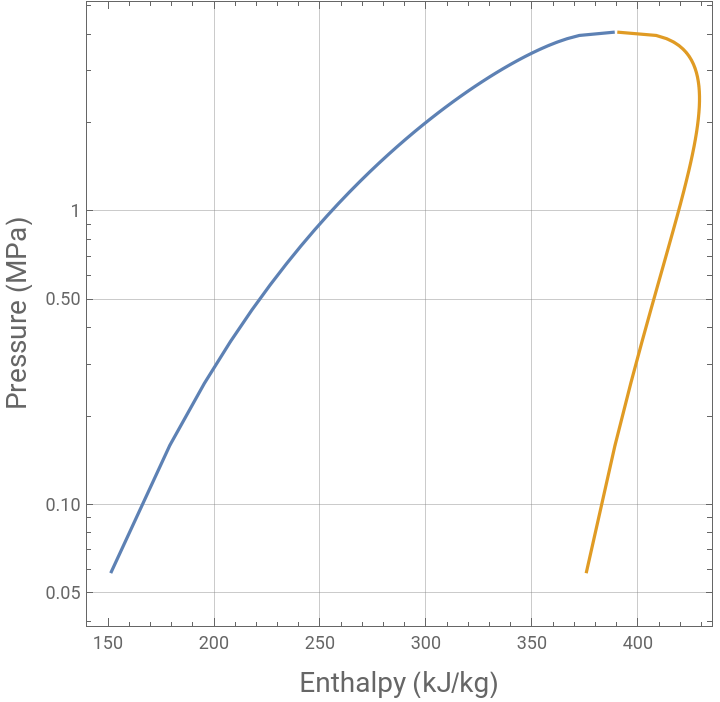
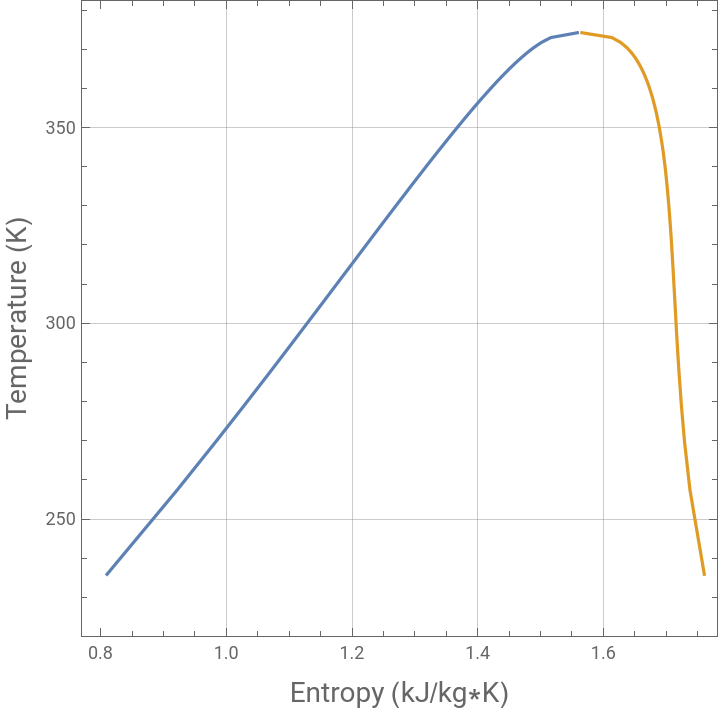
Pressure-Enthalpy (P-H) and Temperature-Entropy (T-S) diagrams for refrigerant R134a are plotted using two sets of data from different sources.
Then, we study an ordinary vapor compression (OVC) cycle. The condenser pressure (high pressure) and evaporator pressure (low pressure) are 1 MPa
and 0.15 MPa. The coefficient of performance (COP), which is the heat transferred to the evaporator divided by the compressor work, is calculated.
Then, we study an ordinary vapor compression (OVC) cycle. The condenser pressure (high pressure) and evaporator pressure (low pressure) are 1 MPa
and 0.15 MPa. The coefficient of performance (COP), which is the heat transferred to the evaporator divided by the compressor work, is calculated.
H - P data from Prof. Falconer's Demonstration @ wolfram demonstration project
H - P data from Prof. Falconer's Demonstration @ wolfram demonstration project
In[]:=
plh={(*{"Enthalpy (kJ/kg)","Pressure (MPa)"},*){151.59,0.059},{179.17,0.159},{195.53,0.259},{207.79,0.359},{217.82,0.459},{226.45,0.559},{234.09,0.659},{240.99,0.759},{247.32,0.859},{253.2,0.959},{258.7,1.059},{263.9,1.159},{268.83,1.259},{273.53,1.359},{278.04,1.459},{282.38,1.559},{286.57,1.659},{290.63,1.759},{294.57,1.859},{298.41,1.959},{302.15,2.059},{305.82,2.159},{309.41,2.259},{312.95,2.359},{316.43,2.459},{319.86,2.559},{323.26,2.659},{326.64,2.759},{329.99,2.859},{333.33,2.959},{336.68,3.059},{340.04,3.159},{343.43,3.259},{346.88,3.359},{350.4,3.459},{354.04,3.559},{357.86,3.659},{361.96,3.759},{366.58,3.859},{372.34,3.959},{388.3,4.059}};pvh={(*{"Enthalpy (kJ/kg)","Pressure (MPa)"},*){375.74,0.059},{389.18,0.159},{396.64,0.259},{401.93,0.359},{406.03,0.459},{409.37,0.559},{412.17,0.659},{414.57,0.759},{416.65,0.859},{418.48,0.959},{420.09,1.059},{421.51,1.159},{422.76,1.259},{423.88,1.359},{424.86,1.459},{425.72,1.559},{426.47,1.659},{427.12,1.759},{427.67,1.859},{428.12,1.959},{428.48,2.059},{428.75,2.159},{428.94,2.259},{429.03,2.359},{429.03,2.459},{428.94,2.559},{428.76,2.659},{428.47,2.759},{428.08,2.859},{427.58,2.959},{426.95,3.059},{426.19,3.159},{425.27,3.259},{424.17,3.359},{422.85,3.459},{421.25,3.559},{419.3,3.659},{416.85,3.759},{413.57,3.859},{408.61,3.959},{391.01,4.059}};
In[]:=
f=Interpolation[plh]
Out[]=
InterpolatingFunction


In[]:=
plt=ListLogPlot[{plh,pvh},JoinedTrue,FrameTrue,AspectRatio1,GridLinesAutomatic,FrameLabel{Style["Enthalpy (kJ/kg)",14],Style["Pressure (MPa)",14]}]
Out[]=
T - S data from Prof. Falconer’s Demonstration @ wolfram demonstration project
T - S data from Prof. Falconer’s Demonstration @ wolfram demonstration project
In[]:=
tls={(*{"Entropy (J/g*K)","Temperature (K)"},*){0.81026,235.89},{0.92186,257.41},{0.98363,269.81},{1.028,278.91},{1.0633,286.23},{1.0928,292.42},{1.1184,297.83},{1.1411,302.64},{1.1616,307.},{1.1803,310.99},{1.1977,314.68},{1.2138,318.12},{1.2289,321.34},{1.2432,324.38},{1.2568,327.25},{1.2697,329.98},{1.2821,332.57},{1.2939,335.06},{1.3054,337.44},{1.3164,339.72},{1.3271,341.92},{1.3375,344.03},{1.3477,346.08},{1.3575,348.05},{1.3672,349.96},{1.3767,351.81},{1.386,353.61},{1.3952,355.35},{1.4043,357.04},{1.4134,358.69},{1.4224,360.29},{1.4313,361.85},{1.4404,363.37},{1.4495,364.85},{1.4588,366.3},{1.4684,367.7},{1.4784,369.08},{1.4891,370.41},{1.5012,371.72},{1.5163,372.98},{1.5585,374.21}};tvs={(*{"Entropy (J/g*K)","Temperature (K)"},*){1.7605,235.89},{1.7377,257.41},{1.729,269.81},{1.7241,278.91},{1.7208,286.23},{1.7183,292.42},{1.7163,297.83},{1.7147,302.64},{1.7132,307.},{1.7118,310.99},{1.7105,314.68},{1.7092,318.12},{1.708,321.34},{1.7067,324.38},{1.7054,327.25},{1.7041,329.98},{1.7027,332.57},{1.7013,335.06},{1.6998,337.44},{1.6983,339.72},{1.6966,341.92},{1.6949,344.03},{1.693,346.08},{1.691,348.05},{1.689,349.96},{1.6867,351.81},{1.6844,353.61},{1.6818,355.35},{1.6791,357.04},{1.6761,358.69},{1.6729,360.29},{1.6694,361.85},{1.6656,363.37},{1.6613,364.85},{1.6566,366.3},{1.6512,367.7},{1.6449,369.08},{1.6373,370.41},{1.6276,371.72},{1.6135,372.98},{1.5658,374.21}};
In[]:=
plt2=ListPlot[{tls,tvs},JoinedTrue,FrameTrue,AspectRatio1,GridLinesAutomatic,FrameLabel{Style["Entropy (kJ/kg*K)",14],Style["Temperature (K)",14]}]
Out[]=
Link for R134a - TetraFlouroEthane Saturation Properties - Pressure Table Pressure Temp volume (m^3/kg) energy (kJ/kg) enthalpy (kJ/kg) entropy (kJ/kg.K) kPa deg C vf vg uf ug hf hfg hg sf sfg sg
Link for R134a - TetraFlouroEthane Saturation Properties - Pressure Table Pressure Temp volume (m^3/kg) energy (kJ/kg) enthalpy (kJ/kg) entropy (kJ/kg.K) kPa deg C vf vg uf ug hf hfg hg sf sfg sg
In[]:=
data={{60.,-36.935,0.00070982,0.31123,3.8148,209.13,3.8574,223.943,227.8,0.01641,0.94805,0.96446},{80.,-31.115,0.00071854,0.23755,11.17,212.47,11.228,220.242,231.47,0.047174,0.909976,0.95715},{100.,-26.361,0.00072593,0.19256,17.225,215.2,17.298,217.162,234.46,0.071951,0.879929,0.95188},{120.,-22.31,0.00073244,0.16214,22.419,217.52,22.507,214.473,236.98,0.092828,0.855012,0.94784},{140.,-18.76,0.0007383,0.14015,26.996,219.56,27.1,212.08,239.18,0.11095,0.83367,0.94462},{160.,-15.588,0.00074368,0.12349,31.107,221.37,31.226,209.894,241.12,0.12701,0.81495,0.94196},{180.,-12.712,0.00074868,0.11042,34.852,223.,34.987,207.893,242.88,0.14148,0.79824,0.93972},{200.,-10.076,0.00075337,0.099877,38.301,224.5,38.452,206.018,244.47,0.15466,0.78313,0.93779},{220.,-7.6377,0.0007578,0.091191,41.506,225.88,41.672,204.268,245.94,0.16678,0.76934,0.93612},{240.,-5.3653,0.00076202,0.083906,44.503,227.16,44.686,202.614,247.3,0.17803,0.75662,0.93465},{260.,-3.235,0.00076606,0.077704,47.325,228.36,47.524,201.036,248.56,0.18853,0.74481,0.93334},{280.,-1.2277,0.00076993,0.07236,49.993,229.48,50.209,199.531,249.74,0.19838,0.73379,0.93217},{300.,0.67206,0.00077366,0.067704,52.527,230.54,52.759,198.091,250.85,0.20767,0.72343,0.9311},{320.,2.4768,0.00077727,0.063611,54.943,231.54,55.192,196.708,251.9,0.21647,0.71367,0.93014},{340.,4.1969,0.00078077,0.059983,57.253,232.49,57.519,195.371,252.89,0.22483,0.70442,0.92925},{360.,5.8412,0.00078418,0.056744,59.469,233.4,59.751,194.079,253.83,0.2328,0.69564,0.92844},{400.,8.9306,0.00079073,0.051207,63.651,235.09,63.967,191.613,255.58,0.24771,0.67927,0.92698},{500.,15.735,0.00080595,0.041123,72.955,238.77,73.358,185.972,259.33,0.28033,0.64375,0.92408},{600.,21.572,0.00081998,0.0343,81.046,241.85,81.538,180.892,262.43,0.30809,0.61376,0.92185},{700.,26.713,0.0008332,0.029365,88.266,244.5,88.849,176.201,265.05,0.3324,0.58761,0.92001},{800.,31.327,0.00084585,0.025625,94.825,246.82,95.501,171.819,267.32,0.35414,0.56429,0.91843},{900.,35.526,0.00085811,0.022687,100.86,248.87,101.64,167.65,269.29,0.37387,0.54313,0.917},{1000.,39.388,0.00087007,0.020316,106.48,250.7,107.35,163.67,271.02,0.39199,0.52367,0.91566},{1200.,46.315,0.00089351,0.016718,116.73,253.84,117.8,156.1,273.9,0.42451,0.48861,0.91312},{1400.,52.422,0.00091671,0.01411,125.97,256.4,127.26,148.89,276.15,0.45326,0.45733,0.91059},{1600.,57.906,0.0009401,0.012126,134.47,258.5,135.97,141.93,277.9,0.47923,0.42872,0.90795},{1800.,62.895,0.000964,0.010562,142.38,260.2,144.11,135.1,279.21,0.50307,0.40203,0.9051},{2000.,67.481,0.00098877,0.0092915,149.83,261.55,151.81,128.33,280.14,0.52524,0.37674,0.90198},{2500.,77.577,0.0010569,0.0069403,167.06,263.51,169.7,111.16,280.86,0.57551,0.31695,0.89246},{3000.,86.203,0.0011413,0.0052813,183.14,263.35,186.56,92.63,279.19,0.62145,0.25778,0.87923}};
In[]:=
delta=148.146;
In[]:=
tbl1=Table[{data[[i]][[9]]+delta,Log[data[[i]][[1]]/1000]},{i,1,Length[data]-4}]
Out[]=
{{375.946,-2.81341},{379.616,-2.52573},{382.606,-2.30259},{385.126,-2.12026},{387.326,-1.96611},{389.266,-1.83258},{391.026,-1.7148},{392.616,-1.60944},{394.086,-1.51413},{395.446,-1.42712},{396.706,-1.34707},{397.886,-1.27297},{398.996,-1.20397},{400.046,-1.13943},{401.036,-1.07881},{401.976,-1.02165},{403.726,-0.916291},{407.476,-0.693147},{410.576,-0.510826},{413.196,-0.356675},{415.466,-0.223144},{417.436,-0.105361},{419.166,0.},{422.046,0.182322},{424.296,0.336472},{426.046,0.470004}}
In[]:=
tbl2=Table[{data[[i]][[7]]+delta,Log[data[[i]][[1]]/1000]},{i,1,Length[data]-4}]
Out[]=
{{152.003,-2.81341},{159.374,-2.52573},{165.444,-2.30259},{170.653,-2.12026},{175.246,-1.96611},{179.372,-1.83258},{183.133,-1.7148},{186.598,-1.60944},{189.818,-1.51413},{192.832,-1.42712},{195.67,-1.34707},{198.355,-1.27297},{200.905,-1.20397},{203.338,-1.13943},{205.665,-1.07881},{207.897,-1.02165},{212.113,-0.916291},{221.504,-0.693147},{229.684,-0.510826},{236.995,-0.356675},{243.647,-0.223144},{249.786,-0.105361},{255.496,0.},{265.946,0.182322},{275.406,0.336472},{284.116,0.470004}}
Both P-H data sets plotted on the same diagram
Both P-H data sets plotted on the same diagram
Both T-S data sets plotted on the same diagram
Both T-S data sets plotted on the same diagram
ENTROPY & TEMPERATURE @ POINT 2 is S2=1.73887 and T2=256.037
POINT 2 IS SATURATED VAPOR @ P=0.15 MPa
POINT 2 IS SATURATED VAPOR @ P=0.15 MPa
ENTHALPY @ POINT 4 is H4=255.496
TRANSFORMATION 4→1 IS ISENTHALPIC H1=H4=255.496
TRANSFORMATION 4→1 IS ISENTHALPIC H1=H4=255.496
ENTHALPY @ POINT 2 is H2=388.272
ENTROPY & TEMPERATURE @ POINT 3 is S3=1.73887 and T3=323.273
TRANSFORMATION 2→3 IS ISENTROPIC hence S3=S2
TRANSFORMATION 2→3 IS ISENTROPIC hence S3=S2
ENTHALPY @ POINT 3 is H3=428.475
SUMMARY OF PRESSURES AND ENTHALPIES @ POINTS 1, 2, 3 AND 4
POINTS 1 IS IN THE TWO-PHASE REGION
LET US DETERMINE ITS QUALITY (EQUAL TO 0.3704)
LET US DETERMINE ITS QUALITY (EQUAL TO 0.3704)
The coefficient of performance is equal to 3.30264
The OVC Cycle drawn on the H-P diagram
TEMPERATURE @ POINTS 1, 3 and 4
The OVC Cycle drawn on the T-S diagram