This project included the development of a workflow in the Wolfram Language to analyze the distribution of tree-cover and the mountainous terrain around Mount Adams. The workflow combines elevation data, NDVI, ESA WorldCover 2021 imagery and data from satellites to analyze vegetation patterns. Tree cover was analyzed with histograms, contours and 3D terrain visualizations at different heights and distances from the mountain peak. Results showed that there was little tree cover near the peak but that the percentage of tree cover generally increased with distance. We also developed reusable Wolfram Language functions to extract and visualize tree cover. This provides a flexible way to harness computers to explore vegetation patterns and potential treeline trends in any mountain ranges.
Introduction
Introduction
Background
Background
The treeline defines the region between tree-covered or forested and non-forested areas. Environmental factors that may restrict tree growth at higher elevations include low temperatures, severe winds, short growing seasons, constant snow cover and limited soil development. As a result, as elevation rises toward the mountain peak, tree cover typically becomes sparser and less continuous.
The treeline’s location and spatial pattern can reveal significant information about how vegetation, topography and environmental factors interact. However, studying mountainous terrain only through field observations is frequently difficult. An effective approach for analyzing vegetation patterns over vast and inaccessible mountains is to use remote sensing and GIS (Geographic Information System) data.
Basic visual information on landscape features and spatial distribution of vegetation is also obtained from true-color satellite images while NDVI (Normalized Difference Vegetation Index) images are used for analyzing the variations in density and greenness of vegetation in the mountainous region. However, visual interpretation and vegetation indices may not always be able to distinguish specific land-cover classes or to classify tree covered vs. non-tree covered areas correctly. This limitation can be overcome with land-cover classification datasets like the ESA (European Space Agency) WorldCover, which offers standardized land-cover types for systematic identification of tree-covered areas. In a computational environment, the combination of satellite imagery, NDVI (Normalized Difference Vegetation Index), ESA WorldCover classification and digital elevation data allow for the processing, visualization and quantitative analysis of images to study the vegetation patterns in relation to the topography to explore potential treeline trends.
Project Objective
Project Objective
This computational essay is intended to create and establish a Wolfram Language approach for examining the relationship between forest cover, elevation and proximity to a mountain peak. We computationally integrated and visualized digital elevation data, satellite images, NDVI and ESA WorldCover 2021 land-cover images with Mount Adams as the primary study area. The analysis provides a measure of the variation in the distribution of tree-cover with the elevation range and the increasing distance from the mountain peak, providing a computational approach to the investigation of potential treeline patterns. We also tried to develop reusable Wolfram Language methods for tree-cover identification and 3D terrain visualization, allowing the technology to be applied to other mountainous regions in the world.
Study area
Study area
Mount Adams
Mount Adams
Mount Adams was the primary study site for development and evaluation of the computational workflow. The mountain has a substantial elevation range and the change in the nature of the vegetation from forested lower slopes to the sparsely vegetated areas near the peak makes a good setting for the study of the relationship of tree cover distribution to topography.
The study area is defined as a geographic area with a 15 km distance from the mountainous site. A uniform raster dimension was applied to ensure consistency across the satellite imagery, land cover data, tree cover masks and elevation datasets used in the study.
Define Mount Adams as the center of the study area and create a 15 km geographic region for subsequent analysis::
In[]:=
mountain=GeoPosition[{46.202411792,-121.490894694}];region=GeoDisk[mountain,Quantity[15,"Kilometers"]];
Define raster dimensions to use when producing region rasters:
In[]:=
rasterDims={800,800};
Data Acquisition and Exploration
Data Acquisition and Exploration
Multiple geospatial datasets were combined to analyze vegetation and elevation patterns within the Mount Adams research area. True-color satellite imagery was used primarily to illustrate surface characteristics, Landsat WELD NDVI imagery supplied data on vegetation distribution, ESA WorldCover 2021 data facilitated the identification of tree-covered areas and digital elevation data offered the topographic information necessary for terrain analysis.
True-Color Satellite Imagery
True-Color Satellite Imagery
A true-color satellite image of the Mount Adams study area served as a visual reference for this study. The image provides a spatial representation of the mountain and its immediate surroundings, which can be compared with vegetation, land cover and elevation data.
Retrieve true-color satellite imagery for the Mount Adams study region:
In[]:=
satImg=GeoImage[region,ImageSize->Medium,RasterSize->rasterDims]
Out[]=
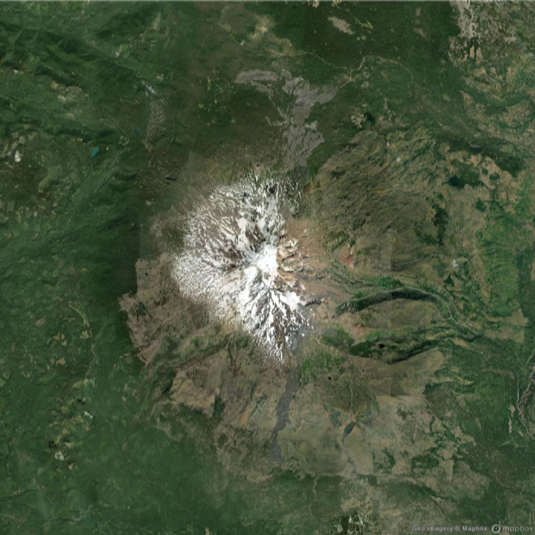
The satellite image provides an initial view of the mountain area. The snow-covered and less vegetated peak region is visually distinct from the darker, more extensively vegetated areas surrounding the mountain.
Landsat WELD NDVI Imagery
Landsat WELD NDVI Imagery
NDVI is often used for analyzing plant patterns by identifying differences in red and near-infrared reflectance. Higher NDVI values often represent thicker and healthier vegetation, while lower values may represent minimal vegetation, barren soil, snow or other non-vegetated surfaces. The darker green areas in the Landsat WELD (Web-Enabled Landsat Data) NDVI image below correspond to areas of more dense and healthier vegetation whereas the lighter green areas correspond to lower vegetation density. The distribution of vegetation over the landscape was visualized through the use of NDVI imagery of the Mount Adams research region.
Retrieve Landsat WELD NDVI imagery to examine vegetation patterns across the study region:
In[]:=
Needs["PhileasDazeleyGaist`RemoteSensing`"]
Retrieve the Landsat WELD NDVI imagery of the study area :
In[]:=
ndviImg=GeoImage[region,GeoServer->GIBSGeoServer["Landsat_WELD_NDVI_Global_Annual"],ImageSize->Medium,RasterSize->rasterDims]
Out[]=
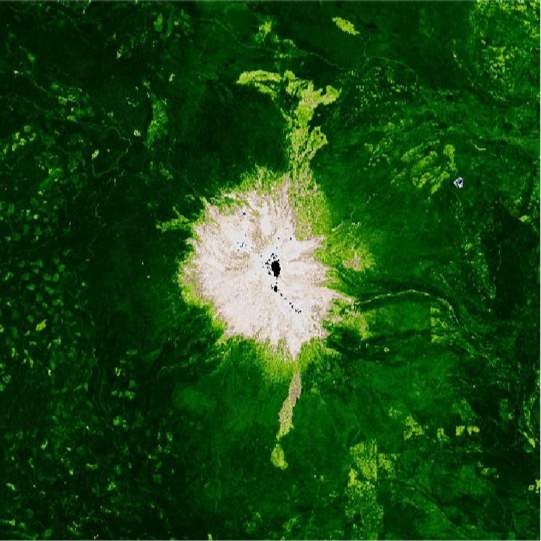
The NDVI image indicates large spatial variation of vegetation within the studied area. The high mountain peak has lower vegetation index values, whereas the neighboring low-elevation terrain shows more distinct and larger vegetation patterns. NDVI images clearly separated the mountain peak with sparse vegetation from the surrounding vegetated areas. However, NDVI does not differentiate between different types of vegetation, such as grass, trees and shrubs, so ESA WorldCover 2021 was used to further examine tree-cover.
ESA WorldCover 2021 imagery
ESA WorldCover 2021 imagery
ESA WorldCover 2021 offers a global classification of land cover based on satellite observation. The dataset classifies land cover into many types: tree-cover, shrubland, grassland, land use, bare surfaces, snow and water. This project uses ESA WorldCover data as the principal source for identifying tree-covered areas. The classified land cover image facilitates assessment of tree-cover patterns with true-color satellite and NDVI images.
Retrieve ESA WorldCover 2021 land-cover data for the Mount Adams study region :
region=GeoDisk[mountain,Quantity[15,"Kilometers"]];worldCover2021=StringTemplate["https://mapproxy.terrascope.be/mapproxy/wmts/esa-worldcover-map-10m-2021-v2_map/webmercator/`1`/`2`/`3`.png"];worldCoverLegend=SwatchLegend[{,,,,,,,,,,},{"Tree cover","Shrubland","Grassland","Cropland","Built-up","Bare / sparse vegetation","Snow and ice","Permanent water bodies","Herbaceous wetland","Mangroves","Moss and lichen"},LegendLayout{"Column",1}];ClearAll[landCoverImage]landCoverImage=Legended[GeoImage[region,GeoServer->worldCover2021,ImageSize->Medium,RasterSize->rasterDims],worldCoverLegend]

Out[]=
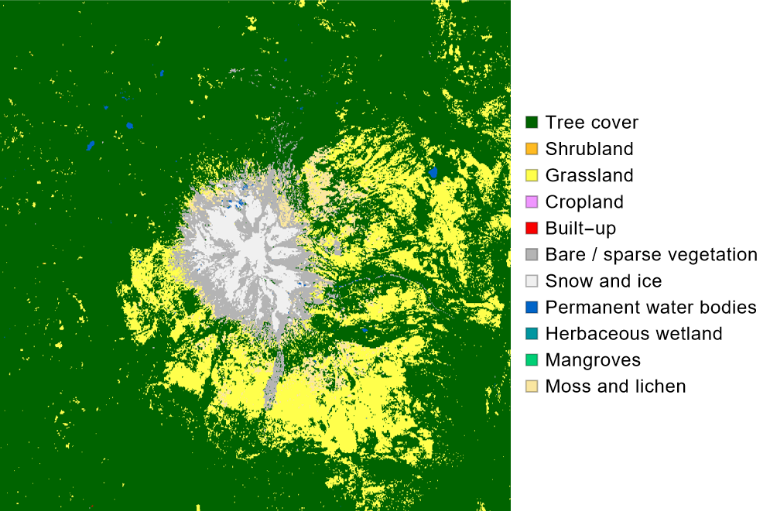
The classed image displays distinct land cover patterns across the study area. Vast forested regions surround the mountain, although the peak and higher elevations display increased amounts of snow, ice and limited vegetation.
Elevation data
Elevation data
We collected elevation data (digital elevation model) for the same geographic area, with the same raster dimensions as the imagery. Because the geographic dimensions are consistent, elevation data may be more easily merged with satellite imagery and tree-cover classifications. The elevation data offer the topographic baseline for generating contours, 3D visualizations and quantitative analysis of tree cover patterns.
Retrieve elevation data in meters across the Mount Adams study region:
In[]:=
elevationData=QuantityMagnitude[GeoElevationData[region,UnitSystem->"Metric",GeoArraySize->rasterDims]];
Topographic Visualization and Comparison
Topographic Visualization and Comparison
Elevation Visualization
Elevation Visualization
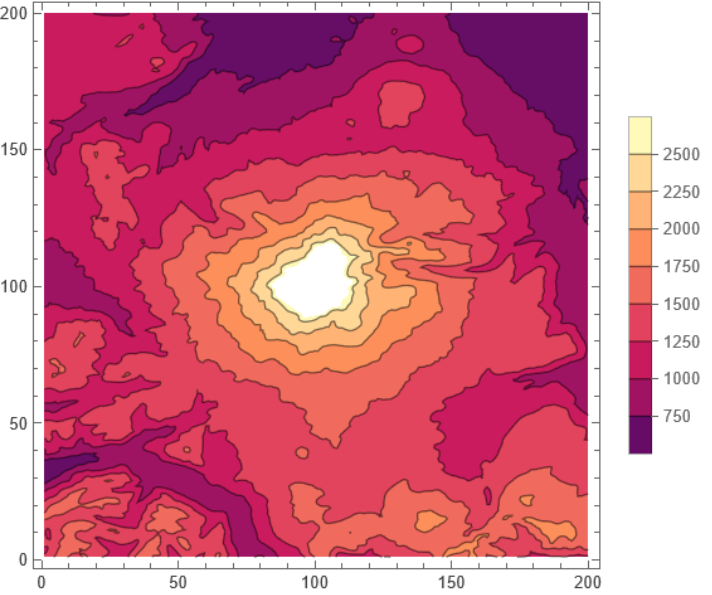
We visualized the digital elevation model to understand the topography near Mount Adams. Elevation values increase towards the volcanic peak and drop towards the surrounding valleys and provide the topographic foundation for the creation of contours and subsequent treeline analysis.
Compute the elevation range in the region of interest:
In[]:=
MinMax[elevationData]
Out[]=
{531.117,3711.45}
Elevation Contour Generation
Elevation Contour Generation
We built elevation contours to show changes in topography across the Mount Adams research region in two dimensions. Contour lines join locations of equal elevation. Contour lines are a useful tool to evaluate the shape of a mountainous region.
Generate elevation contours from the digital elevation data:
In[]:=
ListContourPlot[elevationData,PlotLegends->Automatic]
Out[]=
Comparison of Elevation Contours Across Geospatial Datasets
Comparison of Elevation Contours Across Geospatial Datasets
We examined the link of terrain to surface features by overlaying elevation contours on true-color satellite images, NDVI imagery and ESA WorldCover 2021 land cover data. These data sets are displayed simultaneously so that topography, vegetation health and classified land cover may be visually compared directly.
Overlay elevation contours on the true-color satellite image:
Overlay elevation contours on the NDVI image:
Overlay elevation contours on the ESA WorldCover 2021 image:
Display the three contour visualizations together for comparison:
The comparative graphic shows the relationship between elevation patterns and variations in surface properties and vegetation distribution. The elevated core portion shows little vegetation, although tree coverage increases in the nearby landscape.
Tree Cover Mask Generation
Tree Cover Mask Generation
We used the ESA WorldCover 2021 dataset to identify pixels classified as tree-cover. We extracted the tree-cover class to generate a binary mask that distinguishes tree-covered regions from other land cover types. This mask provides the foundation for subsequent visualization and quantitative analysis of tree-cover distribution.
Tree cover extraction
Tree cover extraction
Retrieve ESA WorldCover 2021 land-cover data for the study region and prepare the classified imagery for tree-cover extraction:
Extract tree-covered regions from the ESA WorldCover 2021 land-cover image for further spatial and quantitative analysis:
The resulting binary mask clearly divides areas with tree-coverage from those without trees. Tree-cover is primarily found in the lower and intermediate elevations surrounding the mountain, although the upper mountain region has significantly less continuous tree cover.
Tree-Cover Edge Detection
Tree-Cover Edge Detection
We applied edge detection to the tree-cover mask to identify boundaries between tree-covered and non-tree-covered areas. Extracted margins comprise several vegetation edges, such as internal forest gaps and lower-elevation limitations. We therefore see these limits as tree-cover borders and not as a single, definite upper treeline.
Apply edge detection to identify the boundaries of the tree-cover mask:
Then, we can set the treeline mask opacity such that the black region is transparent:
Visualization of Tree-Cover and Edges
Visualization of Tree-Cover and Edges
Then we merged the tree-cover mask and detected edges with the true-color satellite imagery. We used a semi-transparent overlay to highlight tree-covered areas while maintaining the visibility of the underlying landscape and topographic features.
Highlight tree-covered regions and their boundaries on the satellite imagery:
The visualization illustrates the spatial distribution of classified tree-cover in respect to the mountainous terrain. The mountain is mainly covered by tree-cover, although the top slopes and peak feature extended areas are devoid of trees.
3D Terrain Visualization
3D Terrain Visualization
The elevation data were utilized to create a 3D model of the Mount Adams topography. Satellite imagery and tree-cover data were used on the elevation surface to illustrate vegetation patterns in connection to mountain topography.
Generate a 3D terrain visualization using elevation data and the tree-cover satellite overlay:
The 3D display offers an improved perspective on the correlation between vegetation and topography. Forested regions are predominantly located on the adjacent slopes and lower elevations, although the top areas of the mountain show reduced tree coverage. The green area shows the tree-cover area for Mount Adams and gray area shows the rocky or grassy or snowy region.
Generalized Approach for Mask Function and 3D Tree-cover Visualization
Generalized Approach for Mask Function and 3D Tree-cover Visualization
Following the development and testing of the process with Mount Adams, generalized Wolfram Language functions were constructed to assess the applicability of the same computational methodology to additional mountainous places.
Tree-cover mask Function
Tree-cover mask Function
We developed a reusable method to access the ESA WorldCover 2021 data for a given geographic extent and extract the tree-cover classification. With the tool it is no longer necessary to manually re-run the complete process of extracting tree cover for each new study area.
Define a reusable function for extracting tree cover from a specified geographic region:
Example:
The application of the function to an other mountain shows that the same tree-cover extraction methodology is applicable beyond the initial Mount Adams study area.
Generalized Tree - Cover Highlighting Function
Generalized Tree - Cover Highlighting Function
We created a secondary function to integrate satellite imagery with the extracted tree-cover mask and contour lines.
Define a reusable function for highlighting tree-covered regions on satellite imagery:
The function was tested using randomly selected mountain entities to evaluate its application across different geographic regions.
Apply the tree-cover highlighting function to a randomly selected mountain:
Generalized Tree-Cover Visualization Across Multiple Mountains
Generalized Tree-Cover Visualization Across Multiple Mountains
We applied the generalized tree-cover detection method to randomly selected mountainous regions to evaluate the workflow’s applicability beyond the original Mount Adams study area. Three mountains were chosen with RandomEntity and the previously established highlightTreeCover method was implemented at each site. The resulting maps integrate satellite imagery with identified tree-cover areas, facilitating a visual comparison of vegetation patterns across various mountainous regions. The dissimilarity in the outputs indicate changes in land cover, topographical features, geographic location and the quality of accessible imagery. This application illustrates the reusability of the built function and its capacity for extensive comparative analysis of tree-cover patterns across several mountain regions.
Select three random mountain entities for testing the generalized tree-cover visualization method:
The results demonstrate that the same tree-cover visualization function can be applied to multiple mountain regions without modifying the fundamental workflow. The detected tree-cover patterns vary among the selected mountains, demonstrating the potential of the generalized method for comparing vegetation distribution across different geographic and topographic environments.
Generalized 3D Tree-Cover Visualization
Generalized 3D Tree-Cover Visualization
We modified the generalized method to generate 3D models that visualize tree-cover distribution across mountainous terrain. Elevation data are obtained for a designated mountainous area and integrated with tree-cover classification to produce a textured terrain surface.
Define a reusable function for visualizing tree-cover distribution across a 3D mountain surface:
The function shows the applicability of the same 3D viewing technique to mountainous areas beyond Mount Adams. This offers a reusable computational code for analyzing and comparing vegetation patterns across various mountainous ecosystems.
Quantitative Analysis of Tree-Cover Distribution
Quantitative Analysis of Tree-Cover Distribution
The visualizations give useful information about the spatial patterns, but a quantitative analysis is required to analyze the link between tree-cover and topography factors. We employed two approaches: 1) assessing the distribution of tree covered spots at different elevation ranges and 2) analyzing variations in the fraction of tree-cover with increasing distance from the mountain peak.
Histogram Analysis of Tree Cover Elevation
Histogram Analysis of Tree Cover Elevation
We extracted elevation data for pixels classed as tree-cover and exhibited their distribution in a histogram. The algorithm identifies the elevation ranges corresponding to the most frequent tree covered pixels.
Generate a histogram showing the elevation distribution of pixels classified as tree cover:
The histogram suggests that tree covered pixels are mainly located in the mid to high elevation ranges, with peak frequency occurring at roughly 1,300-1,500 m. Beyond this range, the quantity of tree covered pixels reduces significantly with increasing elevation. This pattern offers quantitative evidence of alterations in tree-cover distribution across mountainous regions and confirms the visually observation of reduced tree cover at elevated altitudes. The histogram does not clearly identify a specific treeline elevation, however, it offers an analytical framework for analyzing elevation ranges where tree cover is progressively limited and for recognizing possible treeline transition zones.
Tree-Cover Density as a Function of Distance from the Mountain Peak
Tree-Cover Density as a Function of Distance from the Mountain Peak
We identified the pixel with the highest elevation (probably the peak of the mountain) and used it to find the distance of the other raster pixels. Then We divided the area into intervals of increasing distance and calculated the percentage of pixels classified as tree-cover in each interval.
Identify the mountain peak and calculate tree-cover proportion at increasing distances from the peak:
The graph shows that percentage of tree-cover is low near the mountain peak and increases with distance from the peak. Tree-cover increases rapidly from 3 to 6 km away from the peak and then gradually with increasing distance to over 90% in the longest intervals analyzed. The pattern here is few plants near the high point and more trees all around it. But the treeline is not just determined by distance from the peak. We must also consider elevation and the shape of the land.
Concluding Remarks
Concluding Remarks
In this computer-based essay we developed a Wolfram Language workflow to study the distribution of tree cover in mountain areas using satellite images, NDVI, ESA WorldCover 2021 data and digital elevation data. Methods of geospatial, image processing, visualization and quantitative analysis were developed and tested primarily at Mount Adams. The workflow incorporated several geographic datasets, utilized the ESA WorldCover 2021 to pinpoint tree-containing areas and examined the spatial distribution of vegetation using satellite imagery, NDVI and topography. The elevation contours and 3D terrain visualizations gave detailed information about the relationship between the tree-cover and the mountainous terrain.
Quantitative analysis was used to learn more about the distribution of tree-cover. The elevation histogram illustrated the distribution of the tree-covered pixels throughout the range of elevations and the distance-from-peak analysis determined the percentage of tree-covered pixels concerning different distances from the mountain peak. The results showed that there was not much tree cover near the peak, but that the percentage of tree-cover generally went up as you got further away. These analyses provide alternative but useful means of interpreting patterns in vegetation and identifying potential treeline transition zones.
An important achievement of this project was the development of reusable functions in Wolfram Language for tree-cover extraction, satellite image visualization and 3D terrain representation. These functions were used in other mountain areas to demonstrate the adaptability of the computational workflow and to prepare the ground for future comparisons.
Future research may further improve the method to determine treelines in a more automatic and accurate way. The present approach considers patterns of tree cover and potential treeline zones, but does not itself establish a valid upper treeline boundary. Future methods may involve restrictions on ongoing tree-cover but not gaps in forests, pixels of isolated vegetation and boundaries at lower elevations.
The workflow also can be applied to more mountainous regions to understand how plant communities change in different climates and landscapes. Higher resolution satellite images and elevation models may provide more spatial detail. Other environmental variables such as slope, aspect, temperature, precipitation and snow cover may provide a fuller picture of the things that affect the patterns of mountain vegetation and treelines.
Acknowledgments
Acknowledgments
I would like to express my sincere gratitude to my mentor, Phileas Dazeley-Gaist, for their continuous guidance, support and valuable feedback throughout the development of this project. Their suggestions and insights were instrumental in shaping the methodology and improving the computational workflow.
I would also like to extend my sincere appreciation to Stephen Wolfram for suggesting the research direction that inspired this project and provided the foundation for its development. I am grateful to the Wolfram Summer Research Program team, mentors and staff for providing the resources, supportive research environment and assistance that made this project possible. Finally, I would like to thank everyone who contributed suggestions, feedback and encouragement throughout the program.
This structure is the version I recommend using. It follows the computational essay principle of creating a clear sequence of explanatory text, concise input captions, executable computations, visible outputs and interpretation, rather than treating the notebook like a conventional long-form research paper.
References
References
1
.P. Dazeley-Gaist (2023), “RemoteSensing,” Wolfram Language Paclet Repository. https://resources.wolframcloud.com/PacletRepository/resources/PhileasDazeleyGaist/RemoteSensing/
2
.Zanaga, D. et al. (2022), “ESA WorldCover 10 m 2021 v200.” https://doi.org/10.5281/zenodo.7254221
3
.Wolfram Research (2014), GeoElevationData, Wolfram Language function, https://reference.wolfram.com/language/ref/GeoElevationData.html (updated 2019).
4
.Wolfram Research (2017), GeoImage, Wolfram Language function, https://reference.wolfram.com/language/ref/GeoImage.html (updated 2019).
5
.NASA (2026), “Landsat WELD NDVI Global Annual,” Global Imagery Browse Services (GIBS).https://www.earthdata.nasa.gov/news/feature-articles/global-web-enabled-landsat-data-weld-imagery-added-worldview.
AI Disclosure
AI Disclosure
The following generative AI tool was used in this project: ChatGPT by OpenAI used to assist with brainstorming, debugging Wolfram Language code and with paraphrasing. All AI-assisted code, analyses, and written content were reviewed, understood, modified where necessary, and approved by the author.
CITE THIS NOTEBOOK
CITE THIS NOTEBOOK
A Remote Sensing Methodology for Automatic Treeline Detection and Analysis
by Siddhi Patel
Wolfram Community, STAFF PICKS, July 16, 2026
https://community.wolfram.com/groups/-/m/t/3763077
by Siddhi Patel
Wolfram Community, STAFF PICKS, July 16, 2026
https://community.wolfram.com/groups/-/m/t/3763077