In[]:=
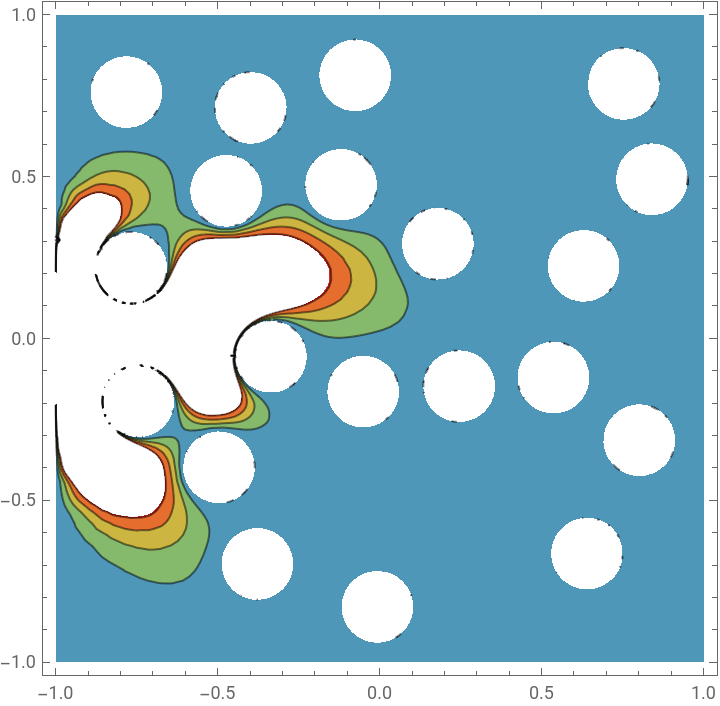
ClearAll[c,t,x,y];(*Definevariables*)vars={c[t,x,y],t,{x,y}};(*Defineparametersincludingdiffusioncoefficientandadvectionvelocity*)pars=<|"DiffusionCoefficient"->1,"AdvectionVelocity"->{10,0}|>;(*Definetheconvection-diffusionequation*)eqn=D[c[t,x,y],t]+pars["AdvectionVelocity"].{D[c[t,x,y],x],D[c[t,x,y],y]}-pars["DiffusionCoefficient"]Laplacian[c[t,x,y],{x,y}]==0;(*Initialcondition*)ic=c[0,x,y]==0;(*Setthedesiredratiooftotalholeareatotherectanglearea*)desiredRatio=0.3;(*Calculatethetotalareaoftherectangle*)rectangleArea=4;(*Calculatethetotalareaoftheholes*)holesArea=desiredRatio*rectangleArea;(*Generatenon-touchingholeswithareasproportionaltothedesiredratio*)SeedRandom[123];numHoles=20;(*Reducednumberofholesforefficiency*)holeRadii=Sqrt[(holesArea/numHoles)/Pi]*0.8;holeCenters=RandomReal[{-0.85,0.85},{1,2}];While[Length[holeCenters]<numHoles,newCenter=RandomReal[{-0.85,0.85},2];If[Min[EuclideanDistance[#,newCenter]&/@holeCenters]>2.4holeRadii,AppendTo[holeCenters,newCenter]]]holes=Table[Disk[holeCenters[[i]],holeRadii],{i,numHoles}];(*Definethespatialdomainwithholes*)Ω=RegionDifference[Rectangle[{-1,-1},{1,1}],RegionUnion@@holes];(*Injectioninletboundaryconditiononx=-1intherange-0.2<y<0.2*)inletBC=DirichletCondition[c[t,x,y]==10,x==-1&&-0.2<y<0.2];(*Wallboundaryconditionsfortheremainingpartsofx=-1*)wallBC=DirichletCondition[c[t,x,y]==0,x==-1&&(y<=-0.2||y>=0.2)];(*No-slipboundaryconditionsforeachhole*)noSlipBCHoles=Table[DirichletCondition[c[t,x,y]==0,Sqrt[(x-holeCenters[[i,1]])^2+(y-holeCenters[[i,2]])^2]<=holeRadii],{i,numHoles}];(*Combineallboundaryconditions*)bc={inletBC,wallBC,noSlipBCHoles};(*Solvetheconvection-diffusionequation*)cfun=NDSolveValue[{eqn,ic,bc},c,{t,0,5},{x,y}∈Ω];(*PlotthesolutionusingContourPlot*)plot=ContourPlot[cfun[0.10,x,y],{x,-1,1},{y,-1,1},ColorFunction->"Rainbow",RegionFunction->Function[{x,y,z},RegionMember[Ω,{x,y}]]]

Out[]=
In[]:=
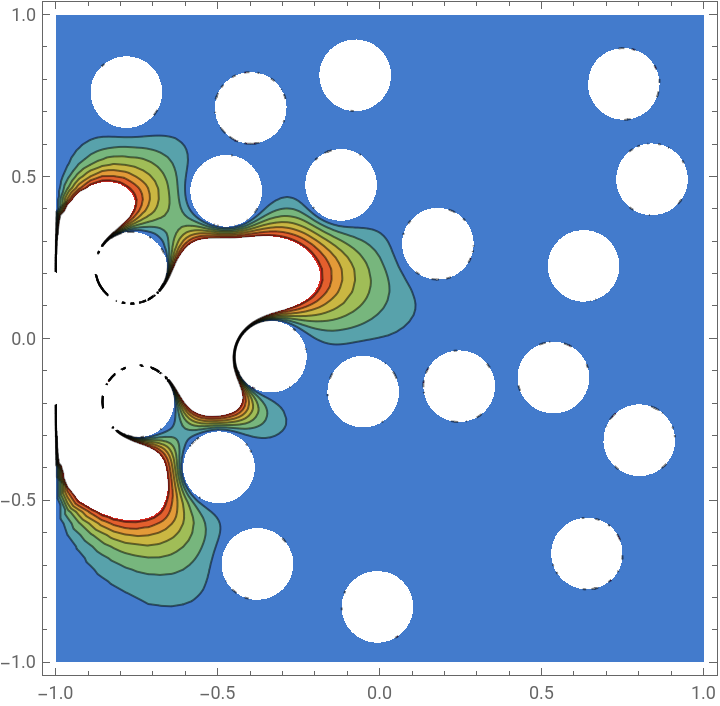
plot=ContourPlot[cfun[0.20,x,y],{x,-1,1},{y,-1,1},ColorFunction->"Rainbow",RegionFunction->Function[{x,y,z},RegionMember[Ω,{x,y}]]]
Out[]=
In[]:=
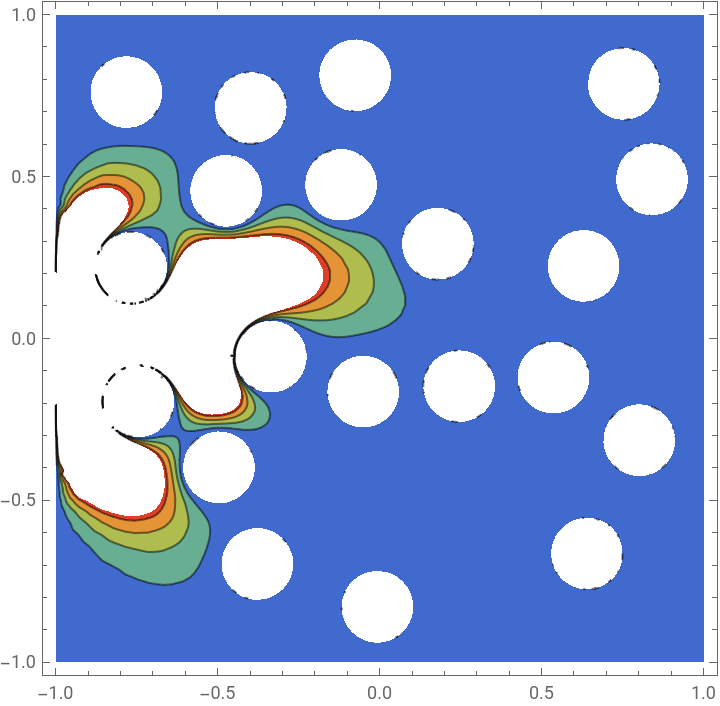
plot=ContourPlot[cfun[0.30,x,y],{x,-1,1},{y,-1,1},ColorFunction->"Rainbow",RegionFunction->Function[{x,y,z},RegionMember[Ω,{x,y}]]]
Out[]=
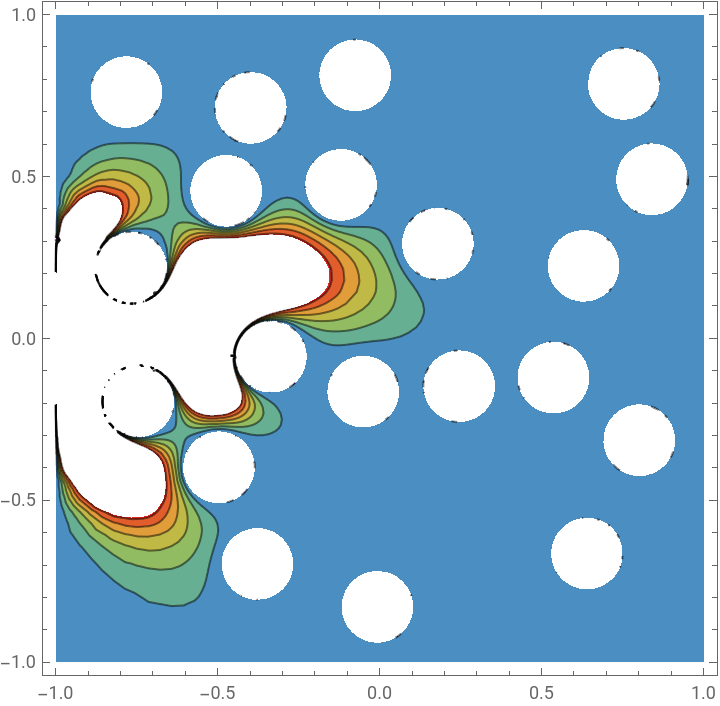
plot=ContourPlot[cfun[0.40,x,y],{x,-1,1},{y,-1,1},ColorFunction->"Rainbow",RegionFunction->Function[{x,y,z},RegionMember[Ω,{x,y}]],]
Out[]=