Introduction
Introduction
What is a neat example? : Concise or straightforward code that produces compelling visual or textual outputs.
Maybe: We know neat when we see it?
The neat examples:
◼
Showcase Wolfram Language (WL) programming.
◼
Give interesting perspectives on what is computationally possible.
Most of the examples in this notebook are inspired (or just “taken”) from WL’s documentation. The initial version of this notebook was based on the presentation "Number theory neat examples in Raku (Set 1)", [AAv1]. The paclet "NumberTheoryUtilities", [AAp1], is extensively used.
Prime numbers
Prime numbers
A table of prime numbers:
Out[]=
1 | 2 | 3 | 4 | 5 | 6 | 7 | 8 | 9 | 10 | 11 |
12 | 13 | 14 | 15 | 16 | 17 | 18 | 19 | 20 | 21 | 22 |
23 | 24 | 25 | 26 | 27 | 28 | 29 | 30 | 31 | 32 | 33 |
34 | 35 | 36 | 37 | 38 | 39 | 40 | 41 | 42 | 43 | 44 |
45 | 46 | 47 | 48 | 49 | 50 | 51 | 52 | 53 | 54 | 55 |
56 | 57 | 58 | 59 | 60 | 61 | 62 | 63 | 64 | 65 | 66 |
67 | 68 | 69 | 70 | 71 | 72 | 73 | 74 | 75 | 76 | 77 |
78 | 79 | 80 | 81 | 82 | 83 | 84 | 85 | 86 | 87 | 88 |
89 | 90 | 91 | 92 | 93 | 94 | 95 | 96 | 97 | 98 | 99 |
100 | 101 | 102 | 103 | 104 | 105 | 106 | 107 | 108 | 109 | 110 |
111 | 112 | 113 | 114 | 115 | 116 | 117 | 118 | 119 | 120 | 121 |
The number of primes seen in the table above is:
PrimePi[11^2]
Out[]=
30
Out[]=
1 | 2 | 3 | 4 | 5 | 6 | 7 | 8 | 9 | 10 | 11 |
12 | 13 | 14 | 15 | 16 | 17 | 18 | 19 | 20 | 21 | 22 |
23 | 24 | 25 | 26 | 27 | 28 | 29 | 30 | 31 | 32 | 33 |
34 | 35 | 36 | 37 | 38 | 39 | 40 | 41 | 42 | 43 | 44 |
45 | 46 | 47 | 48 | 49 | 50 | 51 | 52 | 53 | 54 | 55 |
56 | 57 | 58 | 59 | 60 | 61 | 62 | 63 | 64 | 65 | 66 |
67 | 68 | 69 | 70 | 71 | 72 | 73 | 74 | 75 | 76 | 77 |
78 | 79 | 80 | 81 | 82 | 83 | 84 | 85 | 86 | 87 | 88 |
89 | 90 | 91 | 92 | 93 | 94 | 95 | 96 | 97 | 98 | 99 |
100 | 101 | 102 | 103 | 104 | 105 | 106 | 107 | 108 | 109 | 110 |
111 | 112 | 113 | 114 | 115 | 116 | 117 | 118 | 119 | 120 | 121 |
The table above might look boring, because for any Gaussian prime holds: .
p
p≡3(mod4)
In[]:=
Select[Prime[Range[PrimePi[100]]],PrimeQ[#,GaussianIntegers->True]&]//Mod[#,4]&
Out[]=
{3,3,3,3,3,3,3,3,3,3,3,3,3}
That follows from the Sum of two squares theorem. Relates to Fermat's theorem on sums of two squares.
For example, , hence is not a Gaussian prime.
13=+=(2-3i)(2+3i)
2
2
2
3
13
In the early 1930s, herpetologist Laurence Klauber proposed a geometric arrangement of primes. (Similar to Ulam's spiral , discussed below.)
Grid[TriangleMatrixEmbedding[14,""]/.{(x_?PrimeQ):>Style[x,Red,Bold]}]
Out[]=
1 | ||||||||||||||||||||||||||
2 | 3 | 4 | ||||||||||||||||||||||||
5 | 6 | 7 | 8 | 9 | ||||||||||||||||||||||
10 | 11 | 12 | 13 | 14 | 15 | 16 | ||||||||||||||||||||
17 | 18 | 19 | 20 | 21 | 22 | 23 | 24 | 25 | ||||||||||||||||||
26 | 27 | 28 | 29 | 30 | 31 | 32 | 33 | 34 | 35 | 36 | ||||||||||||||||
37 | 38 | 39 | 40 | 41 | 42 | 43 | 44 | 45 | 46 | 47 | 48 | 49 | ||||||||||||||
50 | 51 | 52 | 53 | 54 | 55 | 56 | 57 | 58 | 59 | 60 | 61 | 62 | 63 | 64 | ||||||||||||
65 | 66 | 67 | 68 | 69 | 70 | 71 | 72 | 73 | 74 | 75 | 76 | 77 | 78 | 79 | 80 | 81 | ||||||||||
82 | 83 | 84 | 85 | 86 | 87 | 88 | 89 | 90 | 91 | 92 | 93 | 94 | 95 | 96 | 97 | 98 | 99 | 100 | ||||||||
101 | 102 | 103 | 104 | 105 | 106 | 107 | 108 | 109 | 110 | 111 | 112 | 113 | 114 | 115 | 116 | 117 | 118 | 119 | 120 | 121 | ||||||
122 | 123 | 124 | 125 | 126 | 127 | 128 | 129 | 130 | 131 | 132 | 133 | 134 | 135 | 136 | 137 | 138 | 139 | 140 | 141 | 142 | 143 | 144 | ||||
145 | 146 | 147 | 148 | 149 | 150 | 151 | 152 | 153 | 154 | 155 | 156 | 157 | 158 | 159 | 160 | 161 | 162 | 163 | 164 | 165 | 166 | 167 | 168 | 169 | ||
170 | 171 | 172 | 173 | 174 | 175 | 176 | 177 | 178 | 179 | 180 | 181 | 182 | 183 | 184 | 185 | 186 | 187 | 188 | 189 | 190 | 191 | 192 | 193 | 194 | 195 | 196 |
Here is a corresponding plot:
In[]:=
MatrixPlot[TriangleMatrixEmbedding[100]/.{(x_Integer/;!PrimeQ[x]):>0}//Unitize,ImageSize->Large,Frame->False,ColorRules->{0->If[CurrentValue[EvaluationNotebook[],LightDark]=="Dark",LABColor[0.09,0,0],LABColor[1,0,0]],1->Red}]
Out[]=
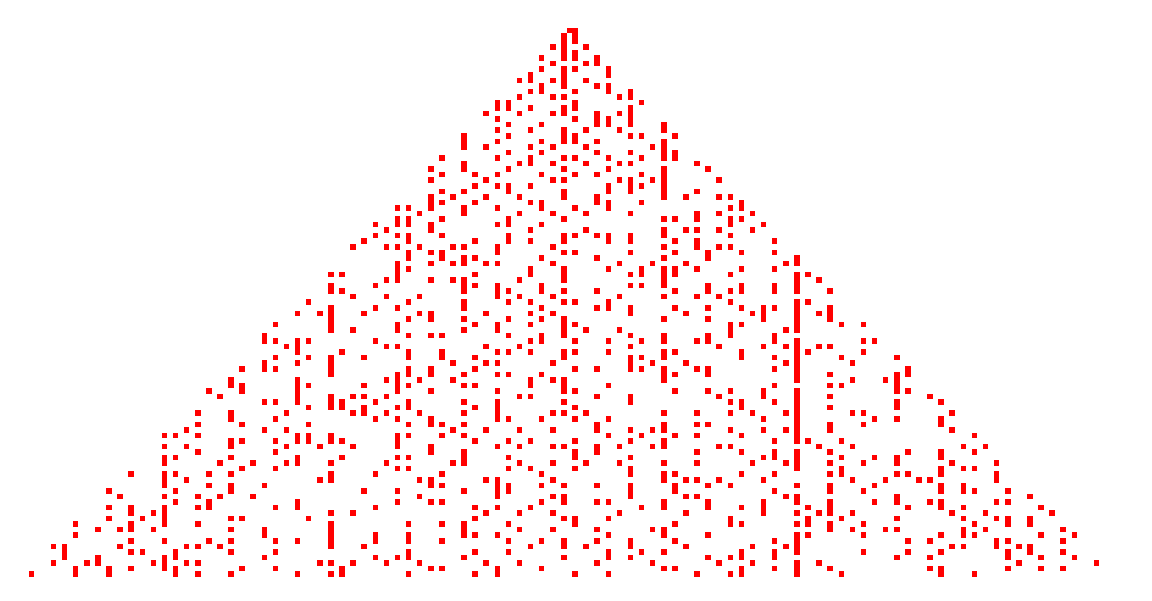
Remark: Special care was taken the plot to “look good” in both light- and dark mode of the notebook.
The Ulam spiral, also known as the prime spiral, is a visual representation of prime numbers created by mathematician Stanisław Ulam in 1963. It gained popularity through Martin Gardner 's Mathematical Games column in Scientific American shortly after. The spiral is formed by arranging positive integers in a square spiral and highlighting the prime numbers.
Remark: Large fraction of the neat examples I plan to present use Ulam spiral.
Spiral lattice with highlighted primes:
SpiralLattice[15,"TopRight"]/.{x_?PrimeQ:>Style[x,Red,Bold]}//Grid
Out[]=
211 | 212 | 213 | 214 | 215 | 216 | 217 | 218 | 219 | 220 | 221 | 222 | 223 | 224 | 225 |
210 | 157 | 158 | 159 | 160 | 161 | 162 | 163 | 164 | 165 | 166 | 167 | 168 | 169 | 170 |
209 | 156 | 111 | 112 | 113 | 114 | 115 | 116 | 117 | 118 | 119 | 120 | 121 | 122 | 171 |
208 | 155 | 110 | 73 | 74 | 75 | 76 | 77 | 78 | 79 | 80 | 81 | 82 | 123 | 172 |
207 | 154 | 109 | 72 | 43 | 44 | 45 | 46 | 47 | 48 | 49 | 50 | 83 | 124 | 173 |
206 | 153 | 108 | 71 | 42 | 21 | 22 | 23 | 24 | 25 | 26 | 51 | 84 | 125 | 174 |
205 | 152 | 107 | 70 | 41 | 20 | 7 | 8 | 9 | 10 | 27 | 52 | 85 | 126 | 175 |
204 | 151 | 106 | 69 | 40 | 19 | 6 | 1 | 2 | 11 | 28 | 53 | 86 | 127 | 176 |
203 | 150 | 105 | 68 | 39 | 18 | 5 | 4 | 3 | 12 | 29 | 54 | 87 | 128 | 177 |
202 | 149 | 104 | 67 | 38 | 17 | 16 | 15 | 14 | 13 | 30 | 55 | 88 | 129 | 178 |
201 | 148 | 103 | 66 | 37 | 36 | 35 | 34 | 33 | 32 | 31 | 56 | 89 | 130 | 179 |
200 | 147 | 102 | 65 | 64 | 63 | 62 | 61 | 60 | 59 | 58 | 57 | 90 | 131 | 180 |
199 | 146 | 101 | 100 | 99 | 98 | 97 | 96 | 95 | 94 | 93 | 92 | 91 | 132 | 181 |
198 | 145 | 144 | 143 | 142 | 141 | 140 | 139 | 138 | 137 | 136 | 135 | 134 | 133 | 182 |
197 | 196 | 195 | 194 | 193 | 192 | 191 | 190 | 189 | 188 | 187 | 186 | 185 | 184 | 183 |
Ulam spiral table:
SpiralLattice[15,"TopRight"]/.{(x_Integer/;!PrimeQ[x]):>""}//Grid
Out[]=
211 | 223 | |||||||||||||
157 | 163 | 167 | ||||||||||||
113 | ||||||||||||||
73 | 79 | |||||||||||||
109 | 43 | 47 | 83 | 173 | ||||||||||
71 | 23 | |||||||||||||
107 | 41 | 7 | ||||||||||||
151 | 19 | 2 | 11 | 53 | 127 | |||||||||
5 | 3 | 29 | ||||||||||||
149 | 67 | 17 | 13 | |||||||||||
103 | 37 | 31 | 89 | 179 | ||||||||||
61 | 59 | 131 | ||||||||||||
199 | 101 | 97 | 181 | |||||||||||
139 | 137 | |||||||||||||
197 | 193 | 191 |
Corresponding plot:
In[]:=
s=SpiralLattice[101,"BottomRight"]/.{(x_Integer/;!PrimeQ[x]):>0};ArrayPlot[s,ImageSize->Large,Frame->False,ColorFunction->"RedBlueTones"]
Out[]=
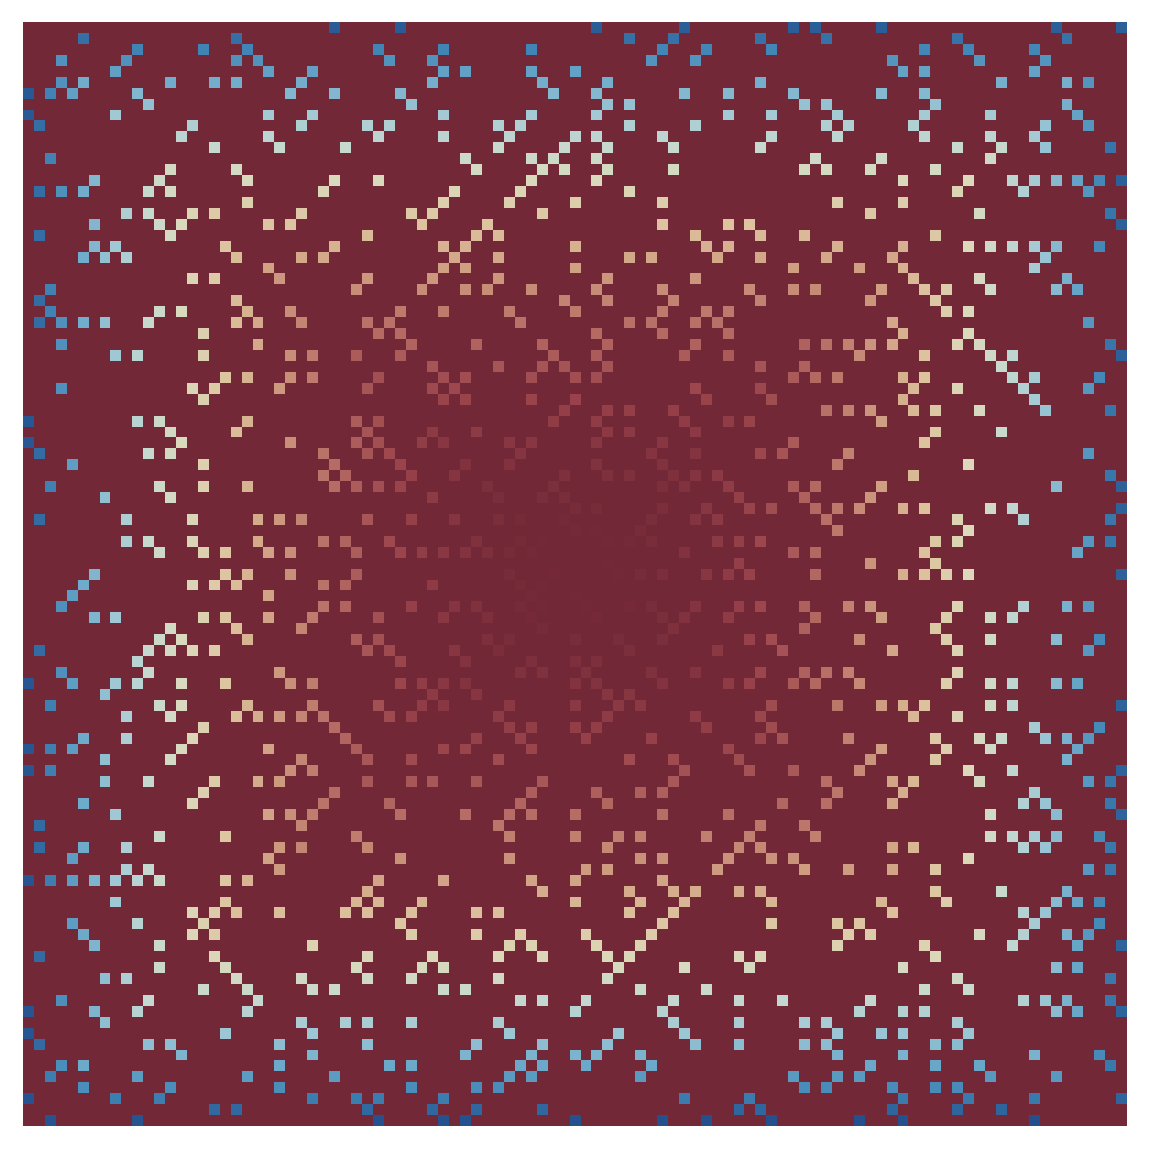
Remark: The more one looks into the center of the plot above, the more details emerge.
Next prime
Next prime
Highlight the sequence of primes using NextPrime:
Sunflower pattern
Sunflower pattern
Here is code that uses NextPrime to categorize the numbers -- using Union drastically reduces the number of the plot points because the records are derived via NextPrime.
Prime Ω
Prime Ω
References
References
◼
[AAp1] Anton Antonov, NumberTheoryUtilities Wolfram Language paclet, (2025), Wolfram Language Paclet Repository.
◼
[AAv1] Anton Antonov, “Number theory neat examples in Raku (Set 1)”, (2025), YouTube@AAA4Prediction.
CITE THIS NOTEBOOK
CITE THIS NOTEBOOK
Number theory neat examples (set 1) primes, Klauber triangle, Ulam spiral, sunflower seed spirals
by Anton Antonov
Wolfram Community, STAFF PICKS, May 30, 2025
https://community.wolfram.com/groups/-/m/t/3470779
by Anton Antonov
Wolfram Community, STAFF PICKS, May 30, 2025
https://community.wolfram.com/groups/-/m/t/3470779