Modeling Photosynthetic Responses to Temperature
Modeling Photosynthetic Responses to Temperature


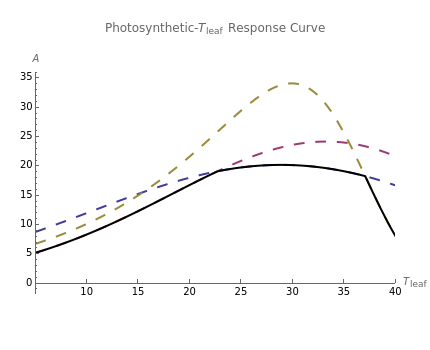
This Demonstration simulates the response of photosynthesis () to leaf temperature (°C). The equations are based on the leaf model of photosynthesis [1] that predicts based on the most limiting of three processes: (1) the kinetics of ribulose-1,5-bisphosphate (RuBP) carboxylase/oxygenase (or rubisco) for fixing , (2) the rate of RuBP regeneration associated with electron transport rates on the thylakoid membrane (RuBP), and (3) the rate in which inorganic phosphate, required for regenerating ATP from ADP, is released during the utilization of triose phosphate (TPU). While the functions associated with all three of these limiting processes are shown (Rubisco, RuBP, and TPU), the actual modeled rate of photosynthesis is the lowest of the three processes. The modeled rates of photosynthesis are indicated by the net photosynthesis curve (solid black line). Vary the parameters or environmental conditions to see the impact on the modeled photosynthesis over the range of . The equations from the original model [1] have been corrected with the temperature functions from [3] for rubisco-limited photosynthesis, [2, 4, 6] for RuBP-limited photosynthesis, and [5] for TPU-limited photosynthesis. Changes in the environmental conditions introduce changes in the leaf intercellular concentration , which are not simulated here.
A
µmol
-2
m
-1
s
T
leaf
A
CO
2
A
T
leaf
CO
2
C
i