A constellation of creative projects with Wolfram Language: from video feedback to modeling cultural evolution
A constellation of creative projects with Wolfram Language: from video feedback to modeling cultural evolution
Phileas Dazeley-Gaist - Wolfram Research
Introductory comments
Introductory comments
Wolfram Language has fantastic tools with which to make art and follow all sorts of creative pursuits, including an incredible library of functions for processing or generating images and vector graphics.
I’m going to share some examples of artistic applications of Wolfram Language from my own portfolio. I hope you’ll enjoy them and that they give you a sense of the vast landscape of possibilities when it comes to using Wolfram Language artistically, and the great versatility of the Wolfram system’s tools.
Video feedback
Video feedback
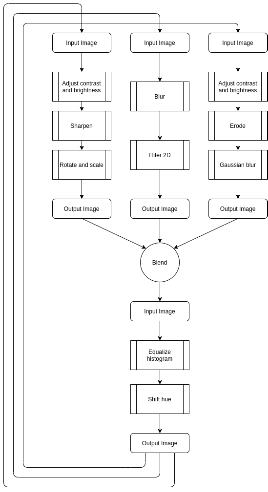
One of my very first Wolfram Language projects was to simulate video feedback digitally by iteratively applying a pipeline of light image processing functions that distorted and added noise to an initial video frame.
This diagram by José María Castelo, who wrote a C++ program called MorphogenCV, on which my Wolfram implementation is based, shows the feedback loop:
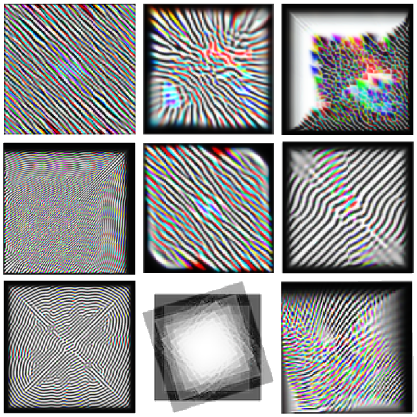
These were some of my results:
In[]:=
BarcodeImage["https://community.wolfram.com/groups/-/m/t/2816083","QR"]
Out[]=

Mathematical marbling
Mathematical marbling
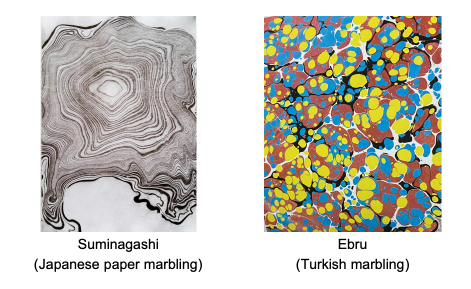
Another project I’m quite proud of is my implementation of Mathematical marbling, a computational simulation of ink marbling design, based on the theoretical work of Aubrey Jaffer.
I wrote a whole set of tools with which to design and visualize marbling designs with vector graphics, simulating marbling moves as Oseen flow.
By combining the functions discussed in previous sections, we can generate an infinite variety of marbling patterns, and easily experiment with marbling ideas. We can also reproduce pattern-making techniques used in physical marbling designs.
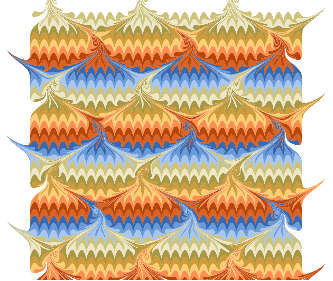
One thing I like about this project is that the simulation helps to build intuition for real world marbling design technique. Take the following pattern, sometimes called the peacock, bouquet, or scallop shells, is often found in end-paper designs:
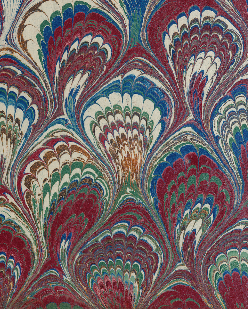
We can reproduce this design by combining geometric sine transformations combing through the digital ink tank, starting with a striped canvas. Here’s my attempt: The result is very regular, and might benefit from additional displacement from 2D noise for a more natural effect.
Out[]=
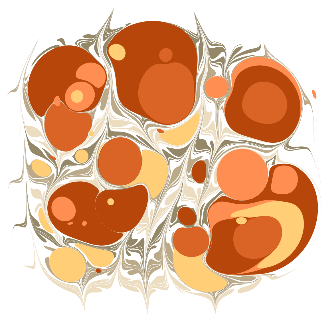
By alternating dripping and combing sequences, we can produce designs resembling Turkish ebru marbling. For example, by dripping, combing up and down, then dripping again with different colors:
Out[]=
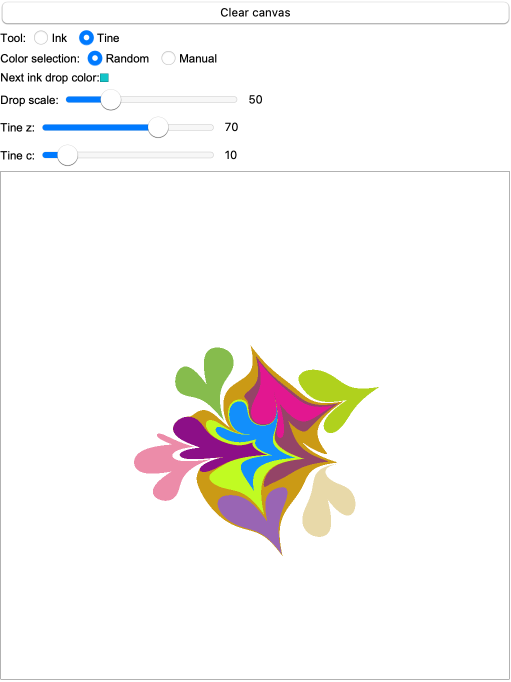
I also designed a simple canvas tool to experiment with making my own designs interactively:
Out[]=
Here are a few more marbling designs I’ve produced using this technique:
Thermal Imaging
Thermal Imaging
I’m an amateur photographer, and I like to take pictures using unusual tools and alternative photographic methods. I’ve had a thermal camera for a few years now, and I’d like to start using more seriously in scientific and creative projects.
It’s a great tool, but it has a really annoying quirk: The images from the camera look like this by default:
That’s right. The FLIR C5 handheld thermal camera bakes the FLIR logo into the image file as well as various camera UI elements if they are enabled, as in this picture of my friend’s cat.
That’s right. The FLIR C5 handheld thermal camera bakes the FLIR logo into the image file as well as various camera UI elements if they are enabled, as in this picture of my friend’s cat.
But if I’m going to use this camera more seriously, I’d like to access the raw sensor readings, of at the very least be able to get an image without all this sensor space wasted by baked in UI elements.
But if I’m going to use this camera more seriously, I’d like to access the raw sensor readings, of at the very least be able to get an image without all this sensor space wasted by baked in UI elements.
It turns out FLIR stores a copy of the raw thermal sensor data in the image’s Exif metadata, and that we can extract it using a command line program called exiftool, which we can call from within WL.
Define the path to exiftool:
Define the image file path:
Import the image:
Extract metadata from the image using exiftool:
Extract the raw thermal image using exiftool
At this point, we can easily visualize the full image with whichever color map we like:
The remaining challenge is to convert these raw readings into temperatures. This takes defining a conversion function based on Plank’s Law (which describes the spectral density of electromagnetic radiation emitted by a black body in thermal equilibrium). I’ve done this, but I won’t get into it today for lack of time.
Slicing a Minecraft map
Slicing a Minecraft map
I occasionally play Minecraft, and at some point, I got curious to see what a plaster cast of the cave network from a Minecraft map would look like.
I found a tool called unmined, which has a command line interface with which I and generated vertical 1 block thick image slices of a 512×512 block area from one of my own games, at every supported altitude for which there were non-transparent blocks.
I loaded these slices into a notebook:
Preview the data:
We can reconstruct the map with a top down view by stacking the image slices like so:
If we binarize the map slice images, multiply the pixel values of each slice by its altitude, and merge the pictures by retaining only the maximum-valued pixels, we get a height map:
We can also scan through the world like this:
Take a mold of the underground structures:
Render the full region:
Spatially bounded interacting cellular automata
Spatially bounded interacting cellular automata
At the last Wolfram Summer School, I had the idea to explore the behaviour of cellular automata that are confined to a specific spatial region, but sensitive to peripheral stimuli from other regions, operating on different CA rules.
I wrote a function to do this called coexistingCellularAutomata. Here’s how you might use it.
Define simulation parameters:
Pick some 2 color range 9-neighbour totalistic CA rules at random:
Define the spatial domains of each rule in the simulation space:
Preview the domain masks:
Use coexistingCellularAutomata as you might use
Animate the resulting simulation of interacting CAs, using the masks to color the frames:
The tool is quite flexible. You can use it on any number of rules, and with arbitrary valid domain masks:
Modeling cultural evolution
Modeling cultural evolution
The final project I want to mention today is near and dear to my heart. It’s the fruit of very recent work over several months coordinating with 9 other artists and researchers all over the world, initiated at the Santa Fe Institute’s Complexity Global School at the Universidad de Los Andes, in Bogota, in August 2025.
Motivation: Empirical data recording how cultural artefacts, motifs, and lineages form in real time, and experimental approaches to document aspects of cultural formation are of great benefit and interest in the study of cultural evolution.
How: Experimental design (nicknamed “Sympoietic Art Organism” in a nod to Haraway) that attempts to richly capture the bottom-up emergence of a shared cultural heritage in a small, controlled setting, as well as the influences at play throughout its evolution.
Our approach called for a small community of artists to engage in active collaborative art making over several months to build up a shared creative commons.
Initial seeding phase round of art contributions to the commons data repository.
Two-week co-creative cycles. Participants are asked to contribute at least five new artefacts to the commons every cycle. Each shared piece must engage with at least one pre-existing artwork (that is, art from earlier cycles). We record these influences between works to a shared ledger.
In this project, over the course of four two-week cycles, we grew a dataset of 411 original artworks, and a network of 725 verified relationships between them. Our experiment yielded a complete history of the creation of the artworks by each participant, and of all acknowledged influences from other pieces, allowing us to reconstruct the citation network of contributed artworks.
We believe this work is important because our approach provides a fairly transparent environment for investigating the mechanisms of cultural inheritance. Another advantage it has is that it generates results suited for quantitative and qualitative analysis.
Network evolution
Network evolution
Round 0 (seeding phase)
Round 0 (seeding phase)
Round 1
Round 1
Round 2
Round 2
Round 3
Round 3
Round 4
Round 4
Table of network properties
Table of network properties
Quantitative example: Co-citation analysis
Quantitative example: Co-citation analysis
List the vertices that cite all of a list of target vertices on a directed graph:
Visualize co-citations between any pair of vertices:
Count the number of co-citations of a list of vertices on a directed graph:
Plot the number of two-piece co-citations per art piece
(how many times is each piece cited alongside another?)
(how many times is each piece cited alongside another?)
Qualitative example:
Embedding the citation network into semantic space
Qualitative example:
Embedding the citation network into semantic space
Embedding the citation network into semantic space
Code Initializations
Code Initializations (Marbling)
Code Initializations (Marbling)
Code Initializations (Minecraft)
Code Initializations (Minecraft)
Code Initializations (Coexisting CAs)
Code Initializations (Coexisting CAs)
Code Initializations (Sympoietic Art Organism)
Code Initializations (Sympoietic Art Organism)