WOLFRAM NOTEBOOK

Neural network to study cosmic air showers
by Chandramauli Agrawal
Indian Institute of Science Education and Research Bhopal
Cosmic Air showers are atmospheric phenomena, which occurs when a cosmic ray hits the upper level of the atmosphere. This initial collision sends a cascade of events downstream into the atmosphere, which can be detected.
The project is inspired from a paper (link in reference) discusses how a air shower characteristics can be found out using a trained network. The project uses a preexisting data, understands it, and train a neural network. The shower property in focus is the maximum penetration of the cosmic ray.

What are Cosmic Air Showers?

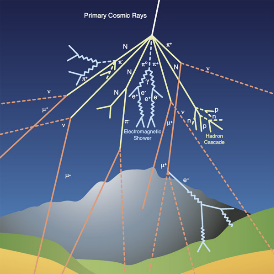
An air shower is cascade of ionized particles and EM waves produced when a cosmic ray (produced in space) enters the atmosphere.
Image Source: See references
The cosmic ray particle can be a proton, an electron, nucleus, a photon or sometimes even positron, strikes an atom’s nucleus in the air producing many energetic hadrons, which ultimately decays to produce other particles and EM radiations.

Importing the Dataset in Mathematica

The data for the project is obtained from the following link: https://desycloud.desy.de/index.php/s/YHa79Gx94CbPx8Q/download.
The downloaded file is in NPZ format, i.e. it is a Zip file containing multiple “.npy” files.
The downloaded file named: 4_airshower_100k_regression.npz was first extracted and it was found to have contained 8 “.npy” files namely:
1
.
X_train_0.npy
2
.
X_train_1.npy
3
.
X_test_0.npy
4
.
X_test_1.npy
5
.
X_train_2.npy
6
.
X_test_2.npy
7
.
y_train.npy
8
.
y_test.npy
Note: All the green highlighted files were the input, blue-the coordinates and red were the ouput to our neural network.
​Mathematica does not directly import “.npy” files so we came up with two ways to do it.
Method-2 is superior due to the over-committing memory issues arising with Method-1.

Method-1: Using ExternalEvaluate

As the name suggests ExternalEvaluate function allows evaluation of an expression using some outer environment (non-Mathematica), in this case Python.

Initiating:

In our earlier workings we were facing issues with Python version 3.9.1
To overcome them, we used an old version (Python 3.6.13). First starting with registering the path to our required version environment.
In[]:=
RegisterExternalEvaluator["Python","C:\Users\chand\anaconda3\envs\python\python.exe"]
Out[]=
94fe59e4-e21b-2853-85ae-508c49ac2d4c
In[]:=
FindExternalEvaluators["Python"]
Out[]=
System
Version
Target
+
Registered
60339dff-7dfe-ed70-ac9b-261eae8ffc3a
Python
3.9.1
C:\Users\chand\AppData\Local\Programs\Python\Python39\python.exe
Automatic
94fe59e4-e21b-2853-85ae-508c49ac2d4c
Python
3.6.13
C:\Users\chand\anaconda3\envs\python\python.exe
True
In[]:=
py=StartExternalSession[<|"System""Python","Version""3.6.13"|>]
Out[]=
ExternalSessionObject
System: Python
Kernel: 3.6.13
UUID: 90504bcc-6a6b-4fe4-8841-e3089bd3ce77

Input (Training and Testing):

We then started bringing the data on Mathematica.
Considering the quantity of data, we will only deal with limited number of data points. We took,
In[]:=
sizeTrain=700;sizeTest=300;
In[]:=
temp=ExternalEvaluate[py,"import numpy as npnp.load(r'C:\\Users\\chand\\Desktop\\Wolfram Winter School\\Dataset\\X_train_0.npy')"];xtrain0=temp[[1;;sizeTrain,All,All,All]];ClearAll[temp];
temp=ExternalEvaluate[py,"import numpy as npnp.load(r'C:\\Users\\chand\\Desktop\\Wolfram Winter School\\Dataset\\X_train_1.npy')"]xtrain1=temp[[1;;sizeTrain,All,All,1]];ClearAll[temp];
temp=ExternalEvaluate[py,"np.load(r'C:\\Users\\chand\\Desktop\\Wolfram Winter School\\Dataset\\X_test_0.npy')"]xtest0=temp[[1;;sizeTest,All,All,All]];ClearAll[temp];
temp=ExternalEvaluate[py,"np.load(r'C:\\Users\\chand\\Desktop\\Wolfram Winter School\\Dataset\\X_test_1.npy')"]xtest1=temp[[1;;sizeTest,All,All,1]];ClearAll[temp];

Detector Coordinates:

In[]:=
xtrain2=ExternalEvaluate["Python","import numpy as np np.load(r'C:\\Users\\chand\\Desktop\\Wolfram Winter School\\Dataset\\X_train_2.npy')"]
Out[]=
NumericArray
Type: Real64
Dimensions: {81,3}
In[]:=
xtest2=ExternalEvaluate[py,"import numpy as np np.load(r'C:\\Users\\chand\\Desktop\\Wolfram Winter School\\Dataset\\X_test_2.npy')"]
Out[]=
NumericArray
Type: Real64
Dimensions: {81,3}
In the given data, both the coordinates for training and testing were found to be same. We can, hence, essentially only use one for our purposes.
In[]:=
xtrain2xtest2
Out[]=
True

Output (Training and Testing):

temp=ExternalEvaluate[py,"import numpy as npnp.load(r'C:\\Users\\chand\\Desktop\\Wolfram Winter School\\Dataset\\y_train.npy')"];ytrain=temp[[1;;sizeTrain]];ClearAll[temp];
temp=ExternalEvaluate[py,"import numpy as npnp.load(r'C:\\Users\\chand\\Desktop\\Wolfram Winter School\\Dataset\\y_test.npy')"];ytest=temp[[1;;sizeTest]];ClearAll[temp];

Method-2: Through CSV format

Our data is first converted into a “.csv” format, and then brought on Mathematica. Similar to what we did previously, we will deal with only a small set of data-points.
Note: The imported data is a 1D list, and thus ArrayReshape is necessary to convert it into the required arrays.
In[]:=
sizeTrain=70;sizeTest=30;

Input (Training and Testing):

In[]:=
xTrain0=Import["C:\\Users\\chand\\Desktop\\Wolfram Winter School\\Dataset\\Shower_data(small)_csv\\xTest0Small.csv","Data"];xTrain0=ArrayReshape[xTrain0,{sizeTrain,9,9,80,1}];xTrain1=Import["C:\\Users\\chand\\Desktop\\Wolfram Winter School\\Dataset\\Shower_data(small)_csv\\xTrain1Small.csv","Data"];xTrain1=ArrayReshape[xTrain1,{sizeTrain,9,9,1}];xTest0=Import["C:\\Users\\chand\\Desktop\\Wolfram Winter School\\Dataset\\Shower_data(small)_csv\\xTest0Small.csv","Data"];xTest0=ArrayReshape[xTest0,{sizeTest,9,9,80,1}];xTest1=Import["C:\\Users\\chand\\Desktop\\Wolfram Winter School\\Dataset\\Shower_data(small)_csv\\xTest1Small.csv","Data"];xTest1=ArrayReshape[xTest1,{sizeTest,9,9,1}];

Detector Coordinates

Output (Training and Testing):

Understanding the Data:

Since the data was given and not produced by us, it was crucial to understand it’s entries.
We know the following information:
  • xTrain2 and xTest2 are the coordinates of detectors.
  • These are the entries of the array.
    , and how they would look on a plane at the z-coordinate: 1400 (m)
    Note that the length scale used here is Meters.
    We find that both the arrays are essentially equal.
    Let’s also check the dimension to make sure we are on the right track!
  • xTrain0 and xTest0 contains the signal bins distributed over 80 time bins, with each bin of size 25 ns, for a given detector and a particular event.
  • Signals at a detector adjacent to the central detector.
    Comparing the above values with the readings obtained on the central detector.
    The signal strength in the other detector is subdued by that from the central detector(where our cosmic shower was centered).
  • xTrain1 and xTest0 contains the knowledge of first modified arrival time
  • So, the data is produced by simulating air shower events and using virtual particle detectors laid in a 2D array fashion (9 by 9, i.e. 81 sensors), providing transient measurements. It contains each particle detector’s information (location) and the 1,00,000 airshower events (in total) interacting with them.

    Constructing the Network

    Our network can be viewed as consisting three parts, as can also be seen from the image:
  • Time Trace Characterization Part
  • Densely Connected Convolutions Part
  • Output Part
  • Image Source: References

    Time Trace Characterization Part

    This part takes an array of shape (9,9,80,1) as input.
    As before, the first two entries determine the detector, third entry denotes the time bin and 1 in the last entry is an artifact of the way our network will be trained. This corresponds to the time traces of one airshower event. Following items tries to explain the overall layer in this part:
  • To characterise this data, three consecutive layers of 1D convolutions are applied to each detector station separately. This translates as implementing three, 3D convolutions with filters of size 1x1 in the spatial dimensions (corresponds to the first two entry in the 2nd argument of the ConvolutionalLayer function)
  • Interleaving: With this being true, last dimension of the input/output array is taken as the channel dimension. Channel dimension is associated to the number of features, that are either at an input or an output of the layer.
  • ElementwiseLayer[Ramp]: Is inserted at alternate levels for faster convergence and it’s action as a non-linear activation function.
  • Stride: Determines the steps size with which the kernel moves through the input for convolutions.
  • ReshapeLayer: To translate the output from a (9,9,1,10) to an array of dimension (9,9,10).
  • Densely Connected Convolutions Part

    This is the main part of the network. As inputs it takes, the extracted time trace features from the previous part and concatenates it with the modified arrival time.
    This part is different from the original paper, where the authors took both the arrival time and the total signal strength, which constituted as an array of (9,9,2) as against what was done in this project; array of (9,9,1) just holding the information of the modified time. Following items is a brief explanation on the components utilised in this part:
  • In the beginning the inputs are concatenated, resulting in the array of dimensions: (9,9,11) obtained as [(9,9,10)+(9,9,1)]. Here the concatenation was done in the 3rd layer, which was the first argument of the CatenateLayer function. The same function is used for concatenation at each alternate layer, where the inputs were the outputs of the previous layer one of which was passed through a Depth-wise separable convolutions.
  • To mimic the Depth-wise separable convolutions, the function sepConv2D is defined. It’s composed of 2 sub layers:
  • Depth-wise convolutions
  • Here, Df = Dp.
  • Point-wise convolutions
  • Here, M = N.
    Note: Source of the images given in the references.
    Using “ChannelGroups” the output of the convolution will have it’s third dimension equal to the group number.
    Meanwhile, PaddingSize-> “Same” constrain the output to have same initial first two dimensions as the input. This constitutes as Depth-wise convolutions.
    The second layer is the Point-wise convolutions.

    Output Part

    This last part, prepares the output tensor of size (9,9,176) by first flattening it and then projecting it with a single, fully connected weight layer, without using activation function onto the regression target.
    Unlike what was given in the paper, we only concern ourselves with Xmax, and that will be the regression target.

    Connecting the Blocks

    Finally wrapping things up, we connect the individual blocks to form the network.

    Training the Network

    Introducing a loss layer, to get an idea of the performance of our Network!
    Making the training and validation sets.
    Let’s start the training!
    Note: TargetDevice used here is GPU.
    Extracting the value of parameters for our completed net layer, using NetExract.

    Checking the Network:

    For any arbitrary input, preferably some data other than the training or testing set, we can now check our network’s performance.
    Here, for the sake of ease, a training data is used.
    While, the actual value was:

    Results

    The project inspired from the paper: “A deep learning-based reconstruction of cosmic ray-induced air showers” tried to explore the possibility of using neural networks to find cosmic air shower properties, here in this case, Maximum penetration of the cosmic ray using Wolfram language capabilities.
    First the huge given dataset (source in references), comprising 1,00,000 cosmic air shower events was segregated and imported on Mathematica using 2 methods: Using ExternalEvaluators and CSV file import.
    Later the project took time to understand the given data , of simulated shower events using various visual aids, followed by training neural net.

    Comments on the Trained Network:

    It was seen that the loss was of the order 10^3. Following are the probable causes that could have led to such an imperfection:
  • The net was trained on an incomplete data set. The input on the total signal strength that was supposed to be fed in the second part of the bulk network was missing.
  • Computational limits of the system used could have been a major factor. While our net was trained using a total of 1000 shower events, of which 700 was given for training and the remaining 300 for testing; the actual data was indeed quite large and was difficult to handle inside normal PC Mathematica.
  • However, it is important to emphasise that the network showed comparable accuracy even with only 100 (70/30) data points against 1000(700/300) data points.
  • Given data could have been erroneous to begin with, the readings could have been scaled or a different padding could have been used.
  • Scope of Future Work:

  • Section on the Cosmic ray can be improved by adding detailed knowledge on the topic, such as
  • The Beginning: Cosmic Rays
    Interaction with the Atmosphere!
    The Detection
  • Explain more on the significance of ML for using it here.
  • Simulating the cosmic shower events here itself, and using it further rather than importing the data.
  • Better visualisations of the data, like representing the detection over the detector coordinate, plane wave of the cosmic event, probable point of first collision and a lot more!
  • Acknowledgment

    Firstly and foremost, I would like to thank Sotiris Michos, my mentor, for his unequivocal help without whom this project could not have been completed. His positive and nurturing attitude made the school very fun and possible to cope even with difficult C-19 circumstances.

    I will also express my gratitude to Rahul Sharma, TA, for helping me resolve bugs and explain me things through the duration of this winter experience.

    My sincere regards to Tuseeta Banerjee for being understanding, Mads and the entire Organising Team for taking us on this educational journey.

    Lastly, I will not forget my Physics professor, Dr Arnab Rudra, who had told me about this amazing school.

    References

  • The paper “A deep learning-based reconstruction of cosmic ray-induced air showers” which inspired the project: https://doi.org/10.1016/j.astropartphys.2017.10.006
  • and its GitHub repository: https://git.rwth-aachen.de/DavidWalz/airshower/-/tree/master
  • The data source: https://github.com/erum-data-idt/pd4ml/blob/b451dc42115fb007112af58214c2dfbf4b1de1dc/pd4ml/pd4ml.py#L2
  • and https://desycloud.desy.de/index.php/s/YHa79Gx94CbPx8Q/download
  • Cosmic rays image: https://www.google.com/url?sa=i&url=http%3A%2F%2Fhome.cern%2Fscience%2Fphysics%2Fcosmic-rays-particles-outer-space&psig=AOvVaw3wB3kUrbDfvQwi7NaA1af4&ust=1642178758778000&source=images&cd=vfe&ved=0CA0Q3YkBahcKEwio3O_flq_1AhUAAAAAHQAAAAAQAw
  • Wolfram Cloud

    You are using a browser not supported by the Wolfram Cloud

    Supported browsers include recent versions of Chrome, Edge, Firefox and Safari.


    I understand and wish to continue anyway »

    You are using a browser not supported by the Wolfram Cloud. Supported browsers include recent versions of Chrome, Edge, Firefox and Safari.