Patterns of hydrogen bonding are among the main regularities that have been found in protein structures. What I have started doing here is to explore the broader set of hydrogen bond formations that a protein can exhibit and extracting the spatial substructures that are associated with those.
Definitions for bigger functions are collected at the bottom.
Extracting Hydrogen Bonds
Extracting Hydrogen Bonds
hydrogenBonds[mol_Molecule]:=Module[{coords=QuantityMagnitude[mol["AtomCoordinates"]],donors=FindMoleculeSubstructure[mol,MoleculePattern[{"O"|"N","H"},{Bond[{1,2},"Single"]}],All],acceptors=FindMoleculeSubstructure[mol,MoleculePattern[{"O"}],All],potHydrogenBond},Reap[Table[{potHydrogenBond=Flatten[Values/@{donors[[i]],acceptors[[j]]}(*givesalistof3atomindices-{Donor,Hydrogen,Acceptor}*)],If[And[(*H-A*)EuclideanDistance[coords[[potHydrogenBond[[2]]]],coords[[potHydrogenBond[[3]]]]]<=2.5,(*D-A*)EuclideanDistance[coords[[potHydrogenBond[[1]]]],coords[[potHydrogenBond[[3]]]]]<=3.5,(VectorAngle[coords[[potHydrogenBond[[1]]]]-coords[[potHydrogenBond[[2]]]],coords[[potHydrogenBond[[3]]]]-coords[[potHydrogenBond[[2]]]]]*(180/Pi))>=150],Sow[potHydrogenBond],Nothing]},{i,1,Length[donors]},{j,Length[acceptors]}];][[-1,1]]]
In this function definition a hydrogen bond is detected whenever there exists a donor-hydrogen-acceptor triple (D, H, A) such that the donor D is an N or O atom with a single bonded hydrogen attached, the acceptor A is an oxygen atom, and a small set of geometric constraints is satisfied. Namely, a hydrogen-acceptor distance of at most 2.5 Å, a donor-acceptor distance of at most 3.5 Å, and a donor-hydrogen-acceptor angle of at least 150°.
This definiton is not fully exhaustive in what donors and acceptor atoms it allows, as well as containing kind off arbitrary cutoffs but it has worked reasonably well.
Proteins and their Hydrogen Bond Graphs
Proteins and their Hydrogen Bond Graphs
trpCageMiniProtein=BioMolecule[ExternalIdentifier["PDBStructureID","1L2Y"]];moltrpCageMiniProtein=Molecule[trpCageMiniProtein];
Small example peptide (NLYIQWLKDGGPSSGRPPPS) consisting of just 20 amino acids. This peptide has 37 potential hydrogen bond donors and 29 potential hydrogen bond acceptors (the way we have defined them above), giving us a total of 1073 hydrogen bonds that could be formed if every possible combination were allowed. In practice hydrogen bond donor and acceptor need to be separated by a certain number of bonds such that, respecting the allowed bond lengths, bond angles and dihedral angles on this path, they can close a cycle. Any such formation of a cycle will greatly reduce the degrees of freedom (particularly rotational ones) on the path between donor and acceptor atom. The number of hydrogen bonds in this peptide, as extracted from its experimentally determined structure is, 7.
Molecule graph of “NLYIQWLKDGGPSSGRPPPS”:

Molecule graph of "NLYIQWLKDGGPSSGRPPPS" with hydrogen bonds (shown in red) added:
Out[]=
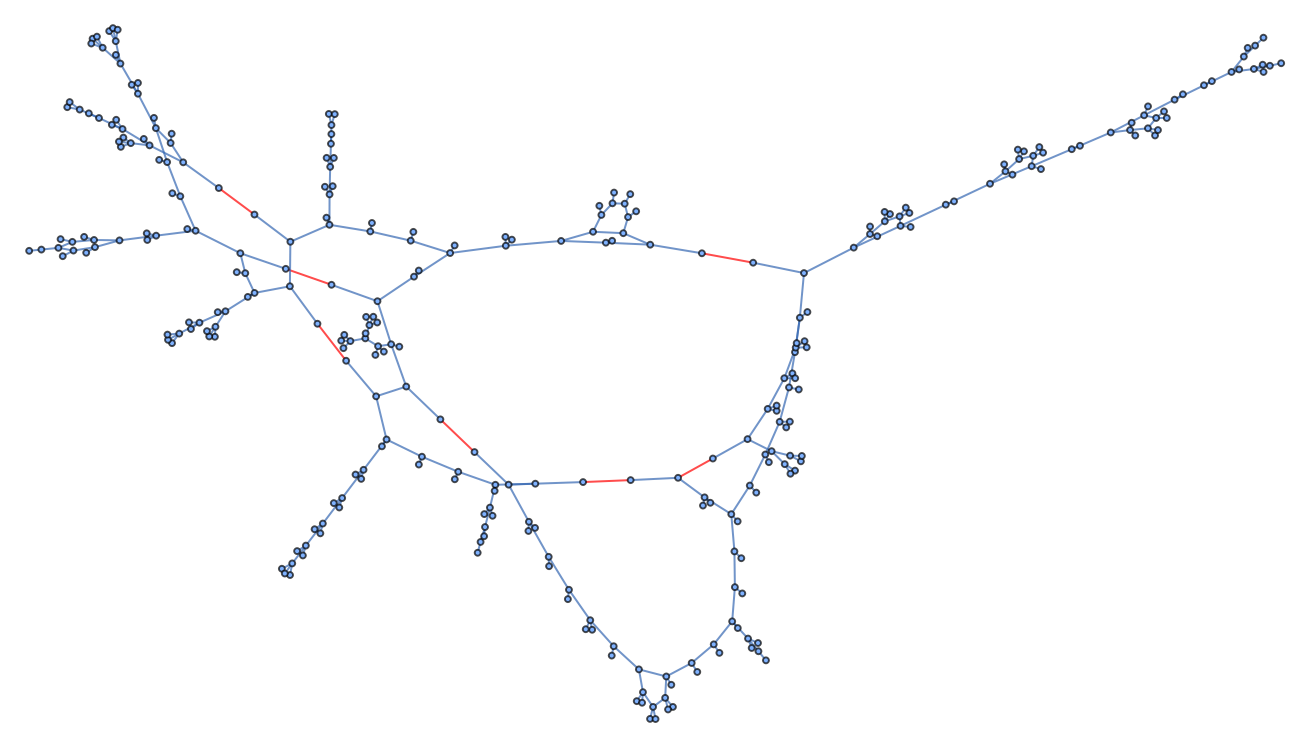
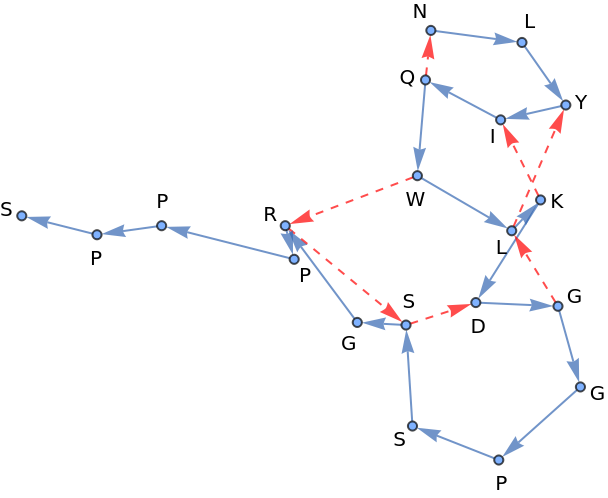
What I originally intended to do was enumerate possible sets of hydrogen bonds and use geometric constraints of allowed bond distances, bond angles and dihedral angles associated with the covalent bonding of the protein, as well as additonal constraints as defined by a set of proposed hydrogen bonds to find out what sets of these bonds for a protein are in principle allowed to exist. And to study the structure of how these sets relate to one another to see whether there is any kind of interesting structure there that might give hints for why convergence to a single set of hydrogen bonds is ussually observed and when that might not be the case. Which is why I orgininally looked at complete molecule graphs like the one above to not loose relevant information but these graphs get very messy for large proteins fast and so, originally for the purpose of visualization, I arrived at a reduced representation. When orientation along the protein backbone (N-terminus -> C-terminus) is encoded as well as direction in a hydrogen bond (donor -> acceptor) we get a representation where, when collapsing the graph down to edges between amino acids, almost all of the information is still implicitely stored in the graphs structure.
Shown below are a 3D plot (left) of the same peptide as above (path along the peptides backbone shown in blue), next to a such a reduced graph representation of that same structure. Blue are peptide bonds beetween amino acids (N-terminus -> C-terminus), red are hydrogen bonds (donor -> acceptor).
Out[]=
NLYIQWLKDGGPSSGRPPPS |
 |

More Examples of Hydrogen Bond Graphs of bigger Proteins
More Examples of Hydrogen Bond Graphs of bigger Proteins
Some of these examples look very ill behaved, switching the GraphLayout from “SpringEmbedding” to “SpringElectricalEmbedding” changes that. I have not looked into what properties make them behave this way under a “SpringElectricalEmbedding”.
Out[]=

Cycles of different lengths in these Hydrogen Bond Graphs
Cycles of different lengths in these Hydrogen Bond Graphs
All visualizations going forward will be derived from the protein below.
These smaller graphs below are the result of extracting all possible cycles up to length 10 from the undirected version of the graph above. Unfortunately these are not reduced to isomorphic forms, so are a lot. Cycles of length 5 are generally associated with β-sheets. Cycles of length 6 with hydrogen bonds on opposite sites are generally associated with β-sheets.
Obvious things to do here to explore these further would be to count them, study their distributions over many proteins and particular protein types or “fold classes” - which of these are generally possible, which ones are rare, which ones dont appear at all (eg. what is the largest number of not covalently connected protein backbone pieces in cycles of length n) etc. and to analyze what combinations of amino acids can form which ones of these and what combinations of the smaller ones can form the larger ones.
Spatial Embeddings of these Hydrogen Bond Subgraphs
Spatial Embeddings of these Hydrogen Bond Subgraphs
These cycles form small spatial subregions so we want to be able to extract these and study their shapes and how much they can differ for a particular small hydrogen bond graph, a substructure made from the same amino acids in the same bond arrangement but in different contexts, which of these generally appear next to which other ones and so on.
Shown below are small hydrogen bond graphs as well as instantiated cases of them in the biomolecule we defined last. Atom coordinates are transferred from that biomolecule.
Acknowledgments
Acknowledgments
I would like to thank my mentor Willem Nielsen, as well as Stephen Wolfram, Jason Biggs and Robert Nachbar for their time, encouragement, suggestions and resources they provided.
References
References
1
.CATH Team (2025), “CATH non-redundant domain dataset S20 (cath-dataset-nonredundant-S20.pdb.tgz),” CATH Database. https://ftp.cbi.pku.edu.cn/pub/databases/CATH/latest_release/non-redundant-data-sets/
CITE THIS NOTEBOOK
CITE THIS NOTEBOOK
Exploring hydrogen bonding patterns in proteins
by Christoph Steck
Wolfram Community, STAFF PICKS, January 15, 2026
https://community.wolfram.com/groups/-/m/t/3607816
by Christoph Steck
Wolfram Community, STAFF PICKS, January 15, 2026
https://community.wolfram.com/groups/-/m/t/3607816