Microbial Survival Curves with Definite Thermal Death Time
Microbial Survival Curves with Definite Thermal Death Time
Traditionally, static microbial survival curves in thermally preserved foods and heat-sterilized pharmaceutical products have been assumed to follow first-order kinetics, implying that absolute sterility is impossible to achieve. This need not be true, especially where the survivors counting method limits the experimental observations to 6 to 8 decades' reduction in the targeted microbe's population. This Demonstration helps visualize the alternative view using simulated semi-logarithmic survival curves generated with an inactivation model having a definite thermal death time as one of its parameters. It describes complete elimination of the microbes, regardless of whether their semi-logarithmic survival curve above the detection level is concave downward, linear or concave upward ("tailing").
Details
Details
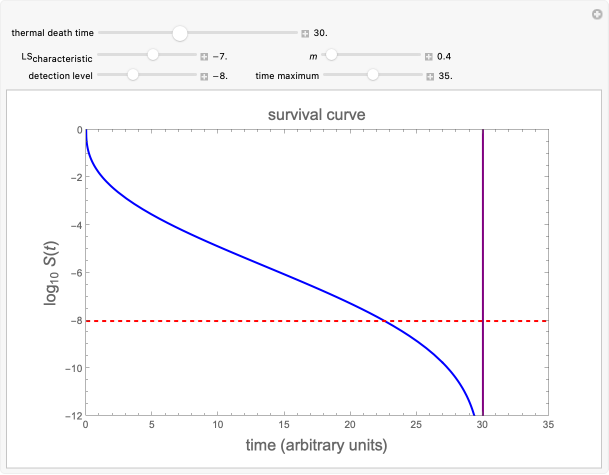
Snapshot 1: simulated semi-logarithmic survival curve that appears to be following first-order kinetics above the detection level. Note that the time for accomplishing is considerably shorter than the absolute thermal death time ().
LS(t)=-12
TDT
Snapshot 2: simulated semi-logarithmic survival curve that appears to exhibit tailing above the detection level. Note that the time for accomplishing is substantially shorter than the absolute .
LS(t)=-12
TDT
Snapshot 3: Simulated semi-logarithmic survival curve with noticeable downward concavity all the way. Note that above the detection level, the curve is practically indistinguishable from a curve following a Weibullian power law model, and that the time to reach is substantially shorter than the absolute .
LS(t)=-12
TDT
Although growing evidence suggests otherwise, the traditional assumption that microbial inactivation follows first-order kinetics is still used to assess the efficacy of heat sterilization in the food and pharmaceutical industries[1]. One of the theoretical implications of this assumption is that the drop in the survival ratio is exponential and hence zero survival can only be approached but not actually reached. The issue also arises in nonlinear kinetics, notably where the Weibullian semi-logarithmic survival curve has upper concavity ("tailing"), that is, a shape factor [2].
α<1
Current microbial counting methods set 6 to 8 decades' reduction in the targeted microbial population's size as the experimental limit. Therefore, the assertion that microbial populations cannot be completely eliminated is based on a model's extension to times and survival ratios where no experimental data exists.
An alternative view is that complete elimination of microbial populations can be and has been achieved in a definite practical time[3], but that accounting for it will require the survival model's modification.
This Demonstration presents such a model. Its purpose is merely to illustrate the concept, not to replace any current inactivation model where applied to describe or predict survival patterns within the ranges covered by experimental data. It has the form
log
10
LS
characteristic
m
-ln
TDT-t
TDT
where is the momentary survival ratio, is a scale parameter, is the thermal death time (the time beyond which no survivors are expected), marked by a solid purple vertical line, and is a shape parameter.
S(t)
LS
characteristic
TDT
m
Where , the initial part of the survival curve has clear upward concavity and where , downward concavity. Where , the initial part of the curve may appear linear (especially if the actual experimental data has some scatter).
m<1
m>1
m~1
To generate a new semi-logarithmic survival curve, displayed as a solid blue curve, select the model's thermal death time, displayed as a solid purple vertical line; the and values; the detection level, displayed as a dashed red horizontal line; and the process's time scale (), with their corresponding sliders.
LS
characteristic
m
time
max
Note that not all the allowed parameter combinations in this Demonstration produce a survival curve that has a real-life counterpart.
References
References
[1] V. J. Juneja and L. Huang, "Thermal Death Time," Encyclopedia of Agricultural, Food and Biological Engineering (D. R. Heldman and C. I. Moraru, eds.), 2nd ed., Boca Raton: CRC Press, 2011 pp. 1668–1670.
[2] M. Peleg, Advanced Quantitative Microbiology for Foods and Biosystems: Models for Predicting Growth and Inactivation, Boca Raton: Taylor and Francis, 2006.
[3] M. Peleg, "Microbial Survival Curves—The Reality of Flat 'Shoulders' and Absolute Thermal Death Times," Foods Research International, 33(7), 2000 pp. 531–538. doi:10.1016/S0963-9969(00)00088-0.
External Links
External Links
Permanent Citation
Permanent Citation
Micha Peleg, Mark D. Normand
"Microbial Survival Curves with Definite Thermal Death Time"
http://demonstrations.wolfram.com/MicrobialSurvivalCurvesWithDefiniteThermalDeathTime/
Wolfram Demonstrations Project
Published: January 15, 2021