In this project, we studied distributed consensus in various distributed systems to gain a better understanding of its implications in real-world scenarios across different domains, such as social media, family and biological networks. We explored distributed consensus using different types of distributions including Bernoulli, Watts-Strogatz and Barabasi Albert distributions. Additionally, we investigated the effects of parameters such as the number of colours and edge probability on reaching a consensus. Our approach began with the analysis of different distributions in preferential consensus scenarios. We explored the trends in reaching consensus by varying parameters. The project also delved into the practical interpretations that can be derived from the analysis and their importance in real-world scenarios. In future, I would like to further explore the Strogatz paradox, investigate the distributions using different iterative dynamics and test the interpretations on real world data.
Introduction
Introduction
This project was an exploration of distributed systems using Wolfram Language. We can think of distributed systems as a set of independent nodes that are interconnected, which influence each other and also get influenced by their surroundings. Various dynamics and conditions can be applied to influence the nodes to change their states accordingly. By using different dynamical conditions of influence on various nodal distributions, we can observe variety of processes and note some interesting patterns and phenomena which also give insights to their real world analogues.
The problem statement first started with trying to find a consensus method for a preferential voting based system. By assigning different colours to each preference pattern, this problem reduced to finding a majority colour i.e. consensus of the nodes and which is solved by using consensus algorithm.
The project explores the impact of various parameters on the outcome by employing the same consensus algorithm across different graph distributions with varying levels of connectedness and a diverse range of colour assignments.
Expanding beyond the initial context of voting systems, the project delves into diverse physical interpretations derived from both theoretical and real-world network graphs, broadening the scope of investigation and analysis.
Creating the Foundation
Creating the Foundation
Generating the Graph
Generating the Graph
We began with exploring ways to create a graph. We first used Random Point Configurations to mark vertices in a region, which can be joined in different ways to create a graph.
In[]:=
pts=RandomPointConfiguration[PoissonPointProcess[100,2],Rectangle[{0,0},{50,50}],100]["Points"][[;;100]];ListPlot[pts]
Out[]=
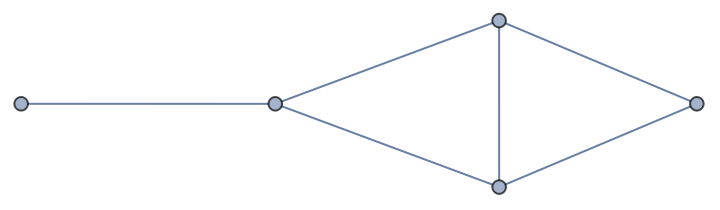
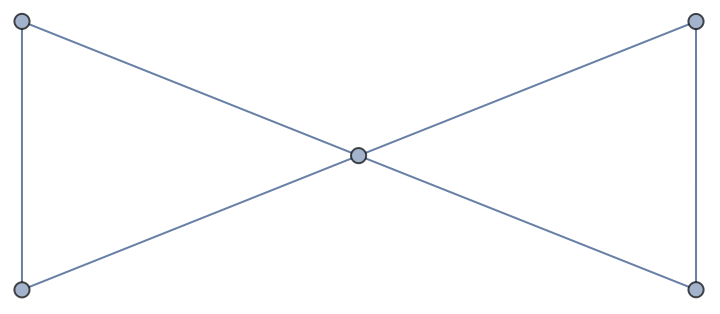
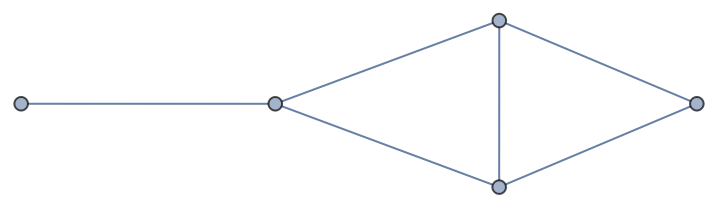
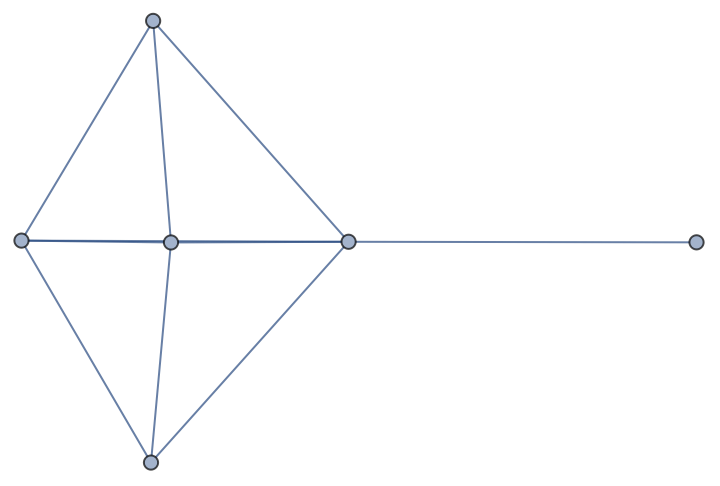
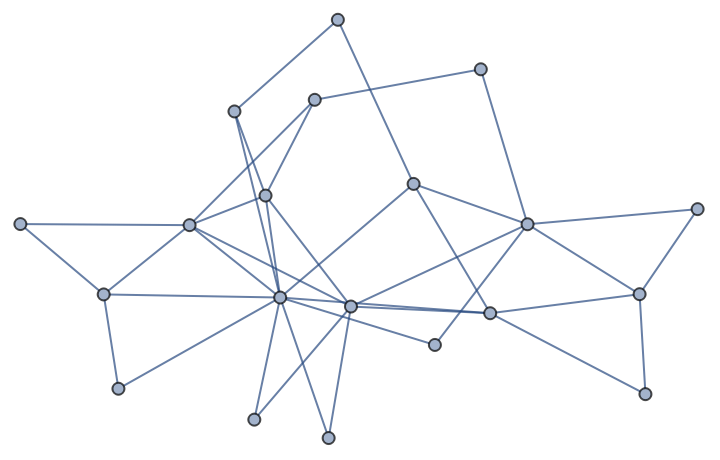
But a better method could be using Random Graph function to create different graphs, of which many resemble real world networks. These graphs can be easily amended to identify and analyse parameters.
In[]:=
RandomGraph[{5(*vertices*),6(*edges*)},3]
Out[]=
,
,
In[]:=
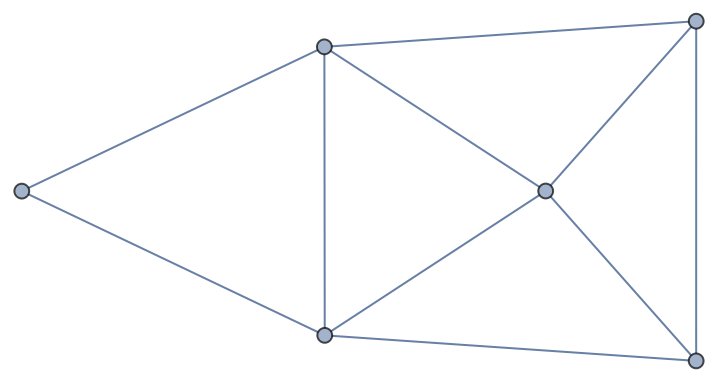
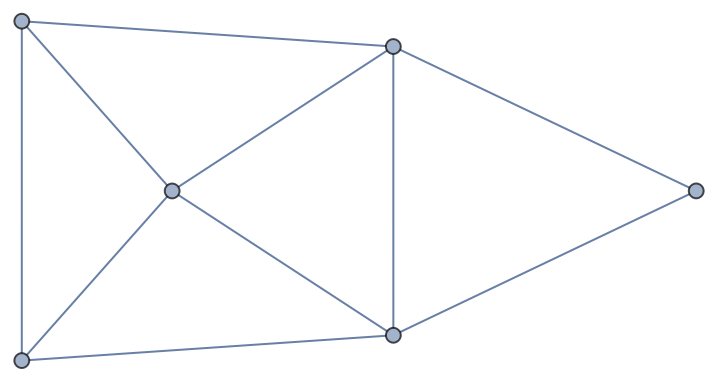
RandomGraph[UniformGraphDistribution[6(*no.ofvetices*),10(*no.ofedges*)],3]
Out[]=
,
,
In[]:=
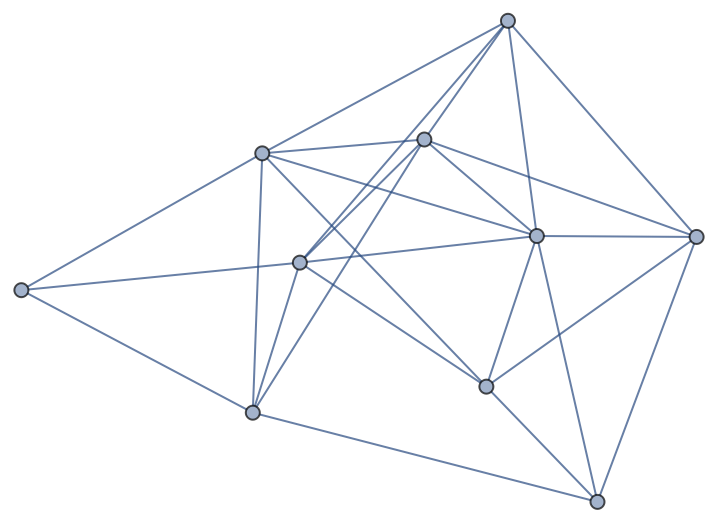
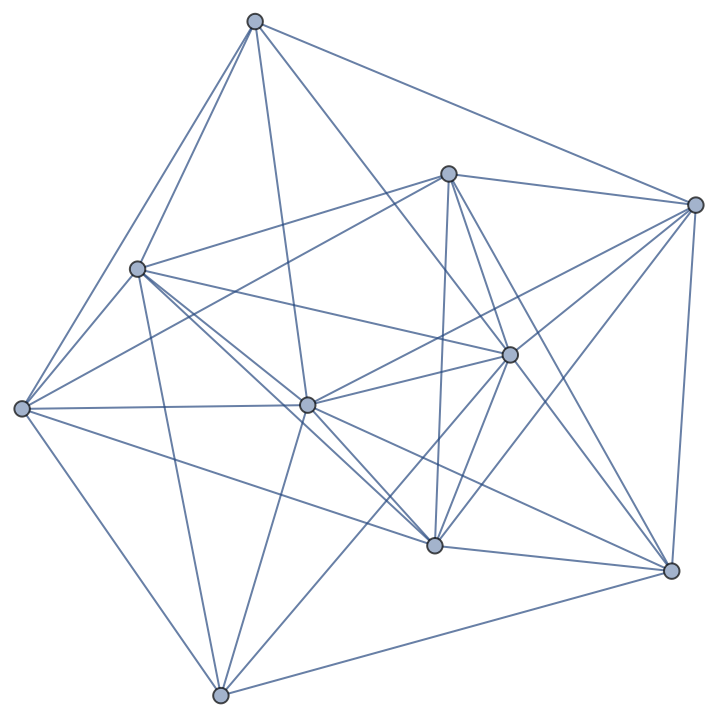
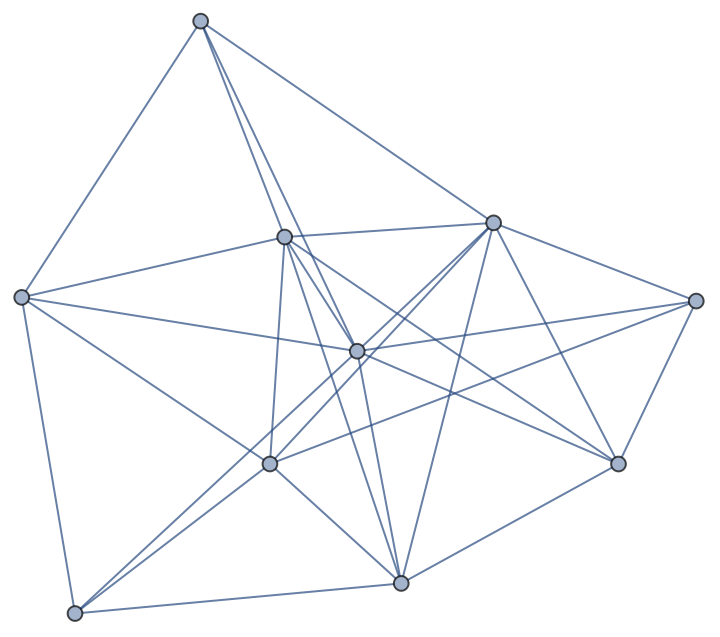
RandomGraph[BernoulliGraphDistribution[10(*no.ofpoints*),0.6(*edgeprobability*)],3]
Out[]=
,
,
g=RandomGraph[BarabasiAlbertGraphDistribution[20(*no.points*),2(*no.ofneighbours*)]]
Out[]=
Nodal Colour
Nodal Colour
Each node can be assigned a random colour by mapping the vertex list of the graph to the set of given colours randomly
In[]:=
colors=Thread[VertexList[g]->RandomChoice[{Black,Red,LightGray},VertexCount[g]]]
Out[]=
{1,2,3,4,5,6,7,8,9,10,11,12,13,14,15,16,17,18,19,20}

In[]:=
Graph[g,VertexStyle->colors]
Out[]=
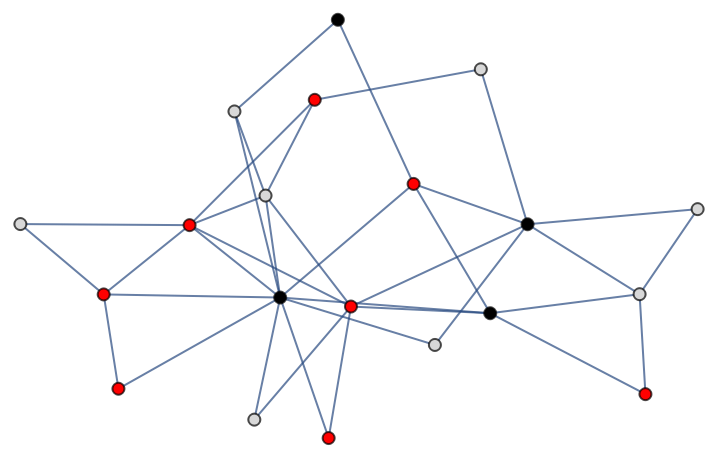
This completes the initial state of assigning colours to the graph.
The Consensus Algorithm
The Consensus Algorithm
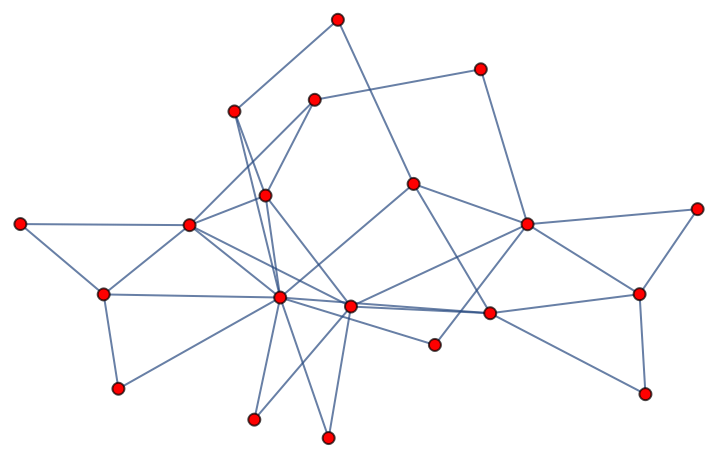
Running a consensus algorithm in a graph can be interpreted as the spread of news or knowledge among the elements of the graph and how they are connected. In this interpretation, each node in the graph represents an entity or individual that possesses certain information or knowledge. The edges between the nodes represent the communication channels or relationships through which information can flow. The consensus algorithm simulates the process of exchanging information and reaching a common agreement or shared understanding among the nodes. As the algorithm progresses, the nodes communicate with their neighbors, sharing their information and updating their own knowledge based on the received information. Through this iterative process, the information gradually spreads across the graph, influencing the beliefs or states of the nodes. The consensus algorithm reflects how information propagates through a network and how consensus or agreement emerges among the nodes.
In[]:=
Iteration[{g_, color_}] := Module[{colorcount, colors = color}, colorcount = Map[Commonest, AdjacencyList[g] /. colors]; Table[If[Length[colorcount[[i]]] == 1, colors = ReplacePart[colors, i -> VertexList[g][[i]] -> colorcount[[i, 1]]], colors = ReplacePart[colors, i -> VertexList[g][[i]] -> RandomChoice[colorcount[[i]]]]], {i, 1, VertexCount[g]}]; {g, colors}]
This algorithm iteratively updates the colour of each node based on the majority colour among its neighboring nodes. In case their is a tie among the majority colours, a random colour is selected, this approach ensures that the algorithm remains impartial and does not favor any specific colour over others.
Here, the ‘colour’ represents the state of the node which can be interpreted as an opinion, electoral preference or anything else depending upon the context in which the graph is used.
Here, the ‘colour’ represents the state of the node which can be interpreted as an opinion, electoral preference or anything else depending upon the context in which the graph is used.
In[]:=
vst=NestList[Iteration,{g,colors},20];ListAnimate[Table[Graph[vst[[i,1]],VertexStyle->vst[[i,2]]],{i,1,Length[vst]}]]
Out[]=
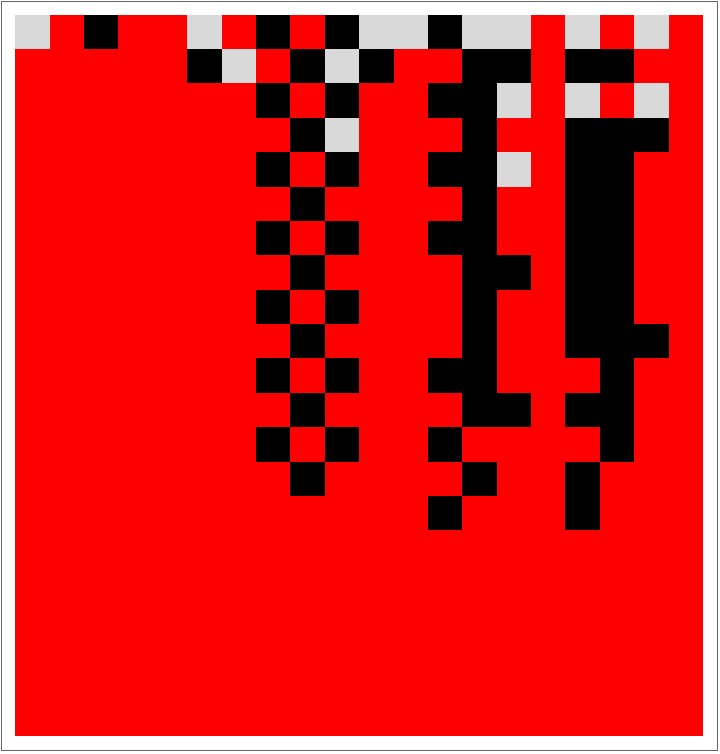
We make an array plot for the nodal colours to analyse changes after each iteration of the consensus algorithm on the graph. The array plot summarises trends more compactly which is helpful in making conclusions.
In[]:=
ArrayPlot[vst[[;;,2,;;,2]]]
Out[]=
Analysing different graph distributions
Analysing different graph distributions
By observing the behavior of the consensus algorithm on different graph distributions with different number of neighbours or edge probability, we can gain a better understanding of how information flows, how it influences the nodes’ states, and how consensus or agreement is reached (or sometimes not reached, when we can have some interesting phenomenons like intermittency, oscillations and chaos depending on the algorithm that we choose) in a networked system.
The Barabasi Albert Graph Distribution
The Barabasi Albert Graph Distribution
For these types of cyclic graphs where each vertex has exactly two neighbors, the information can propagate in a slow and circular manner, which can lead to difficulties in achieving consensus. This behavior is often referred to as the “circular deadlock” or “circular dependency” problem.
In a consensus algorithm, the goal is for all nodes in the graph to agree on a common value or state. However, in a cyclic graph, the information can circulate endlessly between the nodes, making it challenging to reach a consensus. This circular flow can cause delays and prevent the convergence of values among the nodes.
In a consensus algorithm, the goal is for all nodes in the graph to agree on a common value or state. However, in a cyclic graph, the information can circulate endlessly between the nodes, making it challenging to reach a consensus. This circular flow can cause delays and prevent the convergence of values among the nodes.
To overcome the circular deadlock problem and achieve consensus in a cyclic graph, additional mechanisms or modifications to the consensus algorithm may be necessary. One of the mechanisms is to increase the number of neighbours, as even with just three neighbours, a significant improvement is observed in the likelihood of reaching consensus.
The Bernoulli Graph Distribution
The Bernoulli Graph Distribution
In a Bernoulli graph, where each edge is independently selected with a Bernoulli trial with probability p, the probability of two nodes being connected by an edge depends on the value of p . A smaller edge probability (small p) means that the graph will have fewer edges on average, leading to a sparser network structure. Conversely, a larger edge probability (large p) will result in a denser network with more edges.
When running the consensus algorithm in a Bernoulli graph, several factors come into play:
-Edge probability: A smaller edge probability (small p) implies fewer edges and, consequently, longer paths or routes for information to propagate between nodes. This can result in slower convergence and an increased number of iterations required for the nodes to reach consensus.
-Number of vertices: As the number of vertices increases in the graph, the probability of reaching consensus tends to increase. This is because a larger number of vertices typically means more paths and alternative routes for information to flow, allowing for better communication and information exchange. With more paths available, the likelihood of reaching consensus is generally higher.
Bernoulli Graph is quick to reach a consensus !
Due to the properties of the Bernoulli graph, such as its connectivity and structure, consensus can be reached quickly. It is so quick that it reaches consensus within few iterations in most of the cases (even when the edge probability and the number of vertices is low). The connectivity and structure of the Bernoulli graph provide alternative paths and routes for information to flow, enabling rapid information exchange and convergence towards consensus. The decentralized nature of the graph allows nodes to communicate with their neighbors, share information, and update their states iteratively, facilitating the consensus process.
Due to the properties of the Bernoulli graph, such as its connectivity and structure, consensus can be reached quickly. It is so quick that it reaches consensus within few iterations in most of the cases (even when the edge probability and the number of vertices is low). The connectivity and structure of the Bernoulli graph provide alternative paths and routes for information to flow, enabling rapid information exchange and convergence towards consensus. The decentralized nature of the graph allows nodes to communicate with their neighbors, share information, and update their states iteratively, facilitating the consensus process.
The Complete Graph
The Complete Graph
When a complete graph is subjected to a consensus simulation, it tends to reach a consensus state in just a few steps due to its high connectivity. In a complete graph, every vertex is directly connected to every other vertex, resulting in maximum connectivity. This high level of connectivity allows for rapid and efficient information exchange among all nodes in the graph .
The Watts Strogatz Graph Distribution
The Watts Strogatz Graph Distribution
You rarely reach a consensus in Watts Strogatz Distribution !
The Watts-Strogatz graph exhibits particularly intriguing properties compared to others studied thus far. What’s intriguing about Watts Strogatz is that when facing a simulation of a consensus, it is unable to reach consensus even with the small - world properties it possesses, including short average path lengths and high clustering. Its inability to reach consensus is quite intriguing because based on these properties, one would expect it to reach consensus easily given its communicated path. However, the fact that it does not reach consensus gives us more insights since these kinds of networks can be found in nature and social networks.
This observation aligns with an intriguing phenomenon known as the “Strogatz paradox” or “Strogatz effect.” The Strogatz paradox refers to the surprising finding by Duncan Watts and Steven Strogatz in their seminal 1998 paper “Collective dynamics of ‘small-world’ networks”. They discovered that small-world networks, characterized by high clustering and short average path lengths, do not necessarily guarantee efficient information propagation or consensus formation.
In small-world networks, the high clustering indicates the presence of tightly interconnected clusters or communities, where nodes within each cluster are highly connected to one another. The short average path lengths imply the existence of a few long-range connections that allow for relatively quick communication between different clusters.
However, despite these favorable properties, small-world networks can exhibit a phenomenon called “local trapping,” where information or influence remains confined within specific clusters or communities and fails to propagate effectively across the entire network. This local trapping impedes the convergence of opinions or consensus formation in the network.
The Strogatz paradox highlights the intricate interplay between network structure and information dynamics. It reveals that while small-world networks possess some advantages for information spreading, they are not immune to bottlenecks or barriers that hinder consensus formation. The localized nature of interactions in small-world networks can result in limited information flow and prevent global consensus from being reached.
Using variable number of colours
Using variable number of colours
Increasing the number of colours in a consensus simulation results in a higher number of iterations needed to reach consensus. This is due to the increased complexity of the propagation and decision-making process when there are more options to consider.
This phenomenon reflects real-life situations, where an abundance of choices makes decision-making and consensus more challenging. As we encounter numerous decisions in our daily lives, the process of reaching consensus becomes prolonged and intricate, often requiring extensive deliberation and discussion.
This phenomenon reflects real-life situations, where an abundance of choices makes decision-making and consensus more challenging. As we encounter numerous decisions in our daily lives, the process of reaching consensus becomes prolonged and intricate, often requiring extensive deliberation and discussion.
Varying Edge Probability
Varying Edge Probability
In all the graph distributions examined thus far, it has been observed that a higher edge probability or an increased number of neighbors enhances the probability of achieving consensus. Furthermore, raising the edge probability reduces the number of iterations required to reach consensus, indicating that highly connected graphs converge more rapidly.
This finding can be analogous to real-world scenarios where well-connected societies are more likely to reach an agreement compared to less connected ones. Connectedness can be seen as a form of communication, as societies with communication gaps between different communities face challenges in reaching mutual agreements.
This finding can be analogous to real-world scenarios where well-connected societies are more likely to reach an agreement compared to less connected ones. Connectedness can be seen as a form of communication, as societies with communication gaps between different communities face challenges in reaching mutual agreements.
In the Watts Strogatz model, after a few iterations, a steady oscillating pattern emerges . The information tends to cluster together, which aligns with the Strogatz paradox mentioned earlier. When the edge probability is lower, the majority of colours do not oscillate significantly with respect to their position in the graph . This means that the colours remain relatively stable and do not undergo significant changes in a short period of time. The information tends to be more localized within specific clusters or communities, resulting in a higher degree of consensus within those clusters . Conversely, when the edge probability is higher, the majority of colours oscillate with respect to their position in the graph . This indicates that the colours undergo more frequent changes and fluctuations as the information spreads and influences neighboring nodes . The higher probability leads to increased connectivity and more extensive information exchange, causing the colours to oscillate more rapidly.
Real World Networks
Real World Networks
In the end, we also delved to analyse real world networks by using Wolfram Data Repository.
Online Social Network
Online Social Network
Information on Online Social Networks spreads like wild fire !
In online social networks, consensus can be reached relatively quickly within the largest connected component due to the highly connected nature of the network . This phenomenon is commonly observed in real life scenarios like social media platforms and the spread of fake news . Online social networks typically exhibit a power - law distribution of connectivity, where a small number of highly connected individuals or influencers have a significant impact on information dissemination . The largest connected component in the network often consists of these highly connected individuals and their immediate connections .
Biological Networks
Biological Networks
Biological Systems are dynamic they show both regular oscillations within localised clusters and also show irregular patterns indicating that they evolve constantly. These behaviors are attributed to the inherent properties of the network within the biological system. Consensus models in biological systems often involve the coordination and synchronization of various components, such as cells or organisms, to achieve a common state or behavior. This coordination can give rise to regular oscillations within localized clusters, where groups of interconnected entities exhibit synchronized patterns of activity. Examples include the synchronised firing of neurons in the brain or the coordinated movement of cells during development.
Future Work
Future Work
Looking forward, my future endeavors will be dedicated to conducting comprehensive research into the Strogatz paradox, a fascinating phenomenon within network theory that poses thought-provoking questions about the interplay between connectivity and randomness. I would like to gain deeper insights into the Watts-Strogatz Graph Distribution, which exhibits peculiar characteristics. By undertaking an extensive study, I would try to understand it’s implications for real-world networks such as Power Grids, Neural and Social Networks.
Additionally, I would like to explore the distribution patterns that emerge within networks through the utilisation of different consensus algorithms. This exploration will enable me to understand and discover different processes and how do they unfold. In particular, I would like to investigate the power-law dynamics, which plays a crucial role in our understanding of social media platforms and the spread of information within it.
And lastly, I intend to validate and study the interpretations made above by subjecting them to rigorous testing using real-world data. This empirical approach will bridge the gap between theoretical hypothesis made in this exploration and practical observations which I am planning to conduct in future.
Keywords
Keywords
◼
Consensus: General agreement or a majority
◼
Edge Probability: Likelihood or chance of an edge existing between two nodes in a graph
◼
Distributions: Statistical patterns
◼
Network: A collection of nodes
Acknowledgment
Acknowledgment
I would like to thank Elizabeth Alejandra Ortiz Duran, my project mentor, for help, ideas, mentorship, and most importantly for having fun conversations throughout the project. I specially thank Emily Carter for being very helpful throughout my application, reaching out to me regarding online mode and most importantly for making it possible for me to attend this program by granting me full financial aid. I would also like to thank Stephen Wolfram for having a wonderful conversation with me, providing me with an initial definition of the project, for granting me financial aid and for running the Wolfram Summer School 2023. In the end I would like to thank Mads Bahrami, Danielle, Stephanie, Brad Klee and everyone else involved in running Wolfram Summer School 2023.
References
References
CITE THIS NOTEBOOK
CITE THIS NOTEBOOK
Exploration of distributed consensus on graphs
by Mohd Hamza Ahmad
Wolfram Community, STAFF PICKS, July 12, 2023
https://community.wolfram.com/groups/-/m/t/2958268
by Mohd Hamza Ahmad
Wolfram Community, STAFF PICKS, July 12, 2023
https://community.wolfram.com/groups/-/m/t/2958268