I’ve wrangled the Google mobility data for USA and Canada, and put it on Wolfram Cloud. Note that the dataset for USA goes down to the county level, and for Canada down to province/state level.
Collecting data
Collecting data
Get dataset:
ds=CloudGetCloudObject;
Show two rows as example:
In[]:=
ds[{2,-1}]
Out[]=

Visualizations
Visualizations
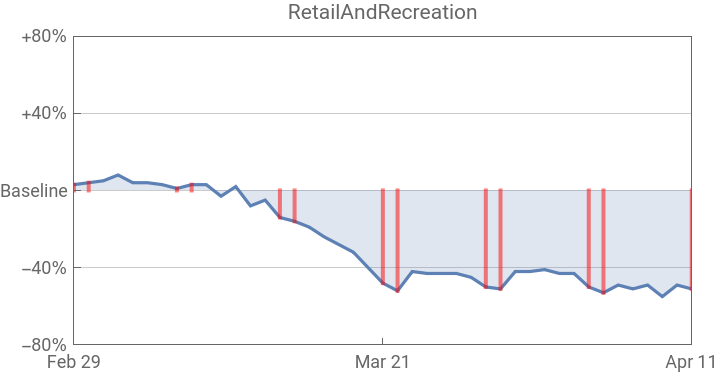
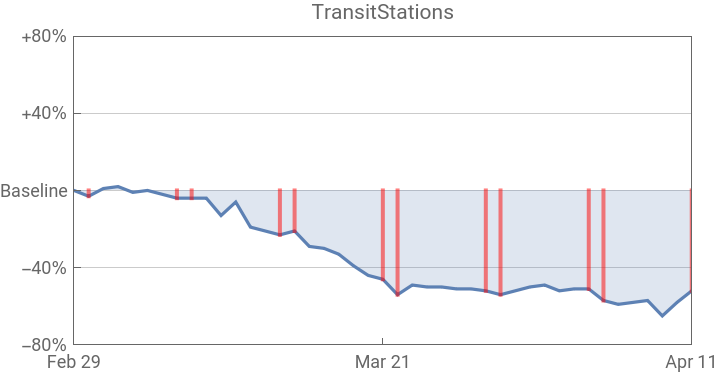
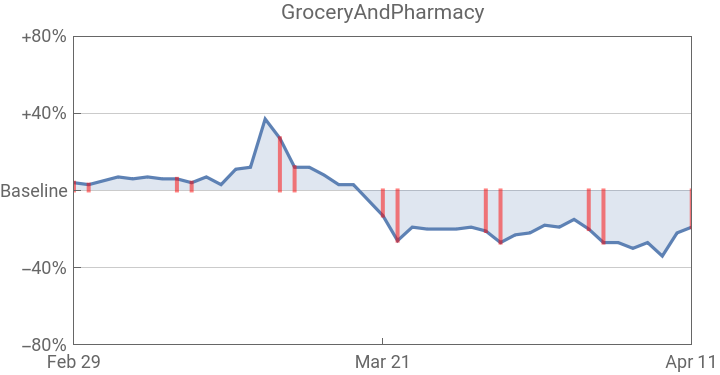
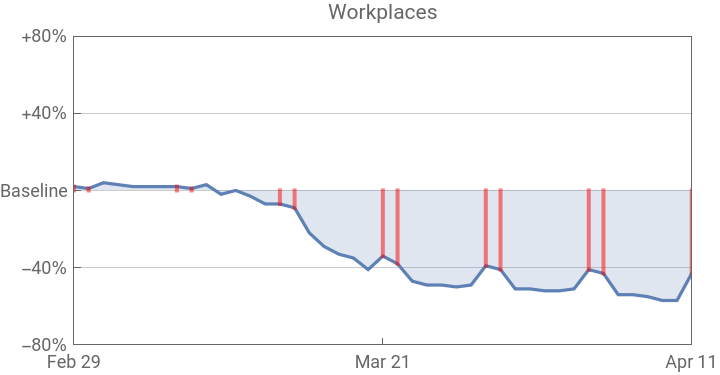
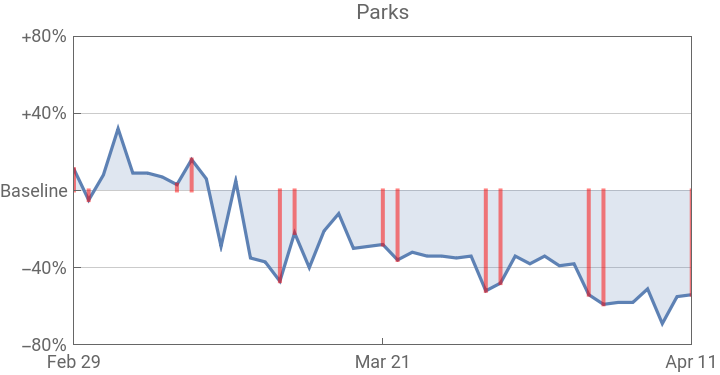
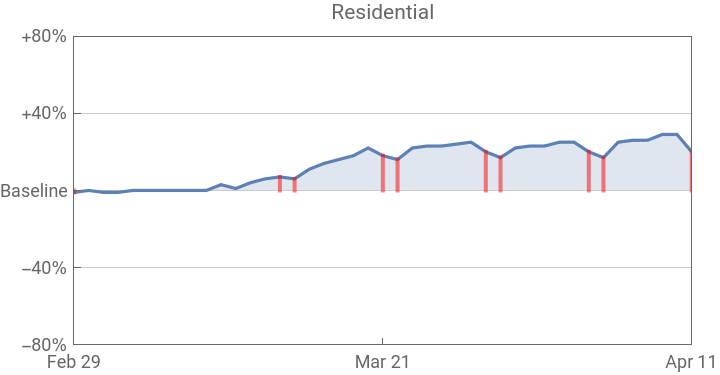
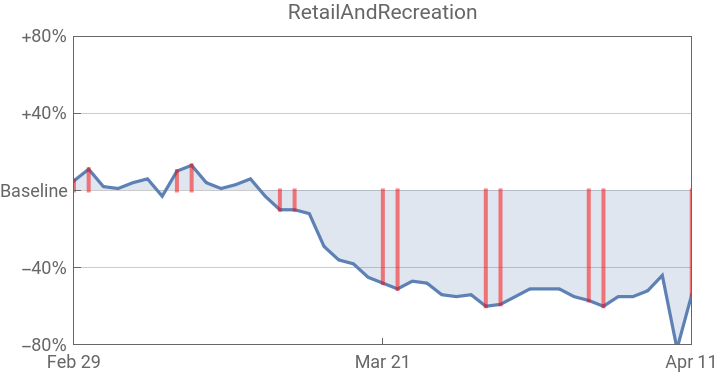
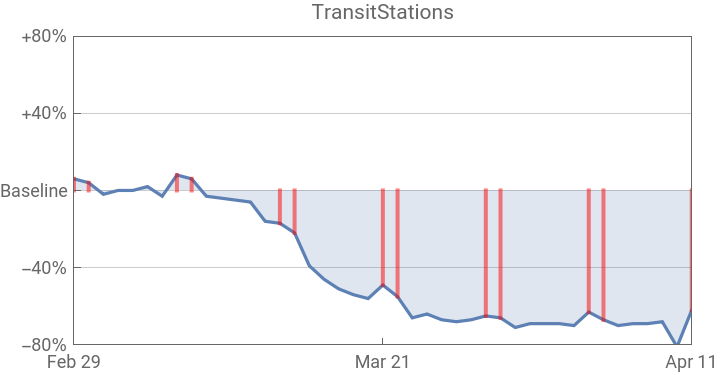
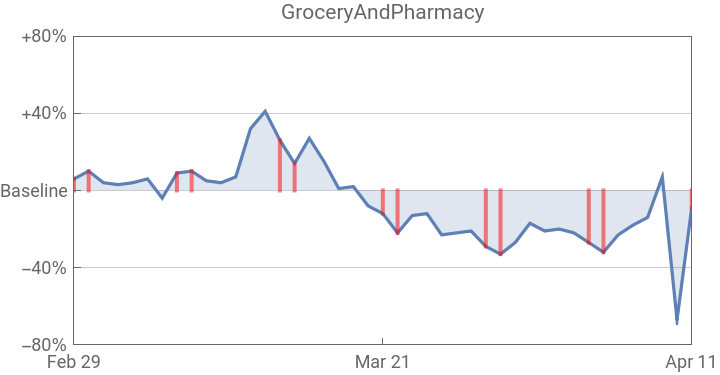
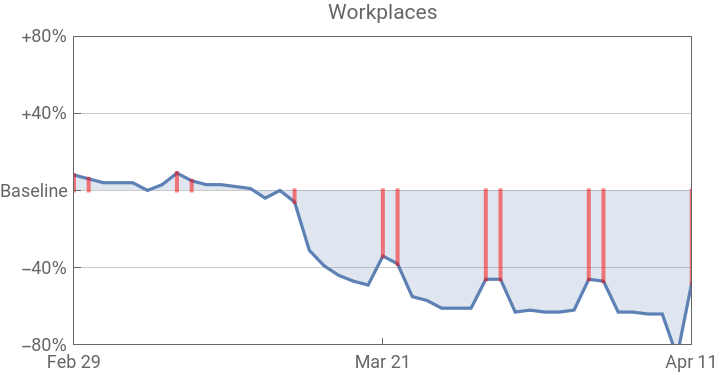
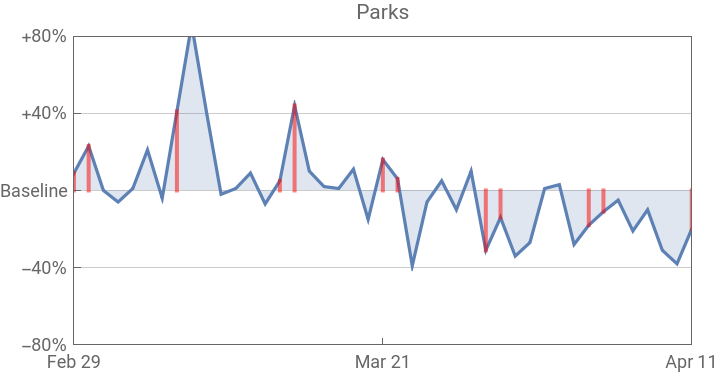
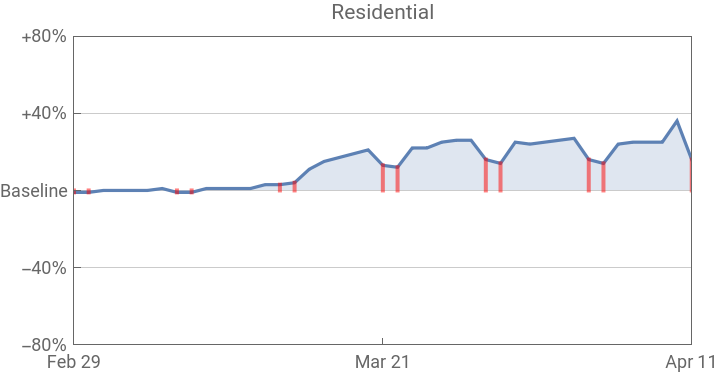
Red fillings in the following graphs correspond to weekends.
Ontario province
Ontario province
Select the Ontario data:
In[]:=
ontario=dsSelectFirst#State==&;
Visualize the data:
In[]:=
MulticolumnKeyValueMapDateListPlot{#2,TimeSeriesResample[#2,"Weekend"]},PlotLabel#1,&[Normal[ontario[4;;]]],2
Out[]=
LA county
LA county
Select the LA county data:
In[]:=
la=dsSelectFirst#County==&;
Visualize the data:
In[]:=
MulticolumnKeyValueMapDateListPlot{#2,TimeSeriesResample[#2,"Weekend"]},PlotLabel#1,&[Normal[la[4;;]]],2
Out[]=