Recently we had a series of posts about the latest solar eclipse:
But that it unseen from the USA territory. While in 2017 there will be a solar eclipse with its 100% visibility (total eclipse) path spanning across USA:
In[]:=
date=SolarEclipse[DateObject[{2017,1,1,0,0}]]
Out[]=
In[]:=
data=SolarEclipse[date,"TotalPhasePolygon",EclipseType->"Total"];GeoGraphics[{GeoStyling[None],Opacity[1],Red,dataT},GeoRange->{{0,55},{-135,-53}},GeoProjection->"Mercator"]
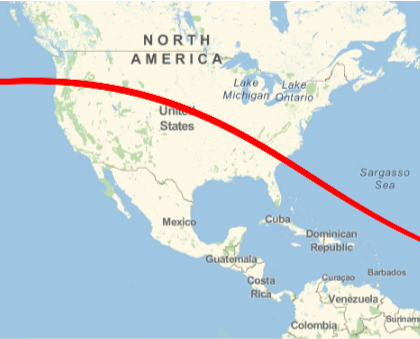
We can get all US states and counties from where the total 2017 eclipse will be visible. Here are the states:
adus=GeoEntities[data,"AdministrativeDivision"];Cases[adus,Entity[_,{_,_}]]

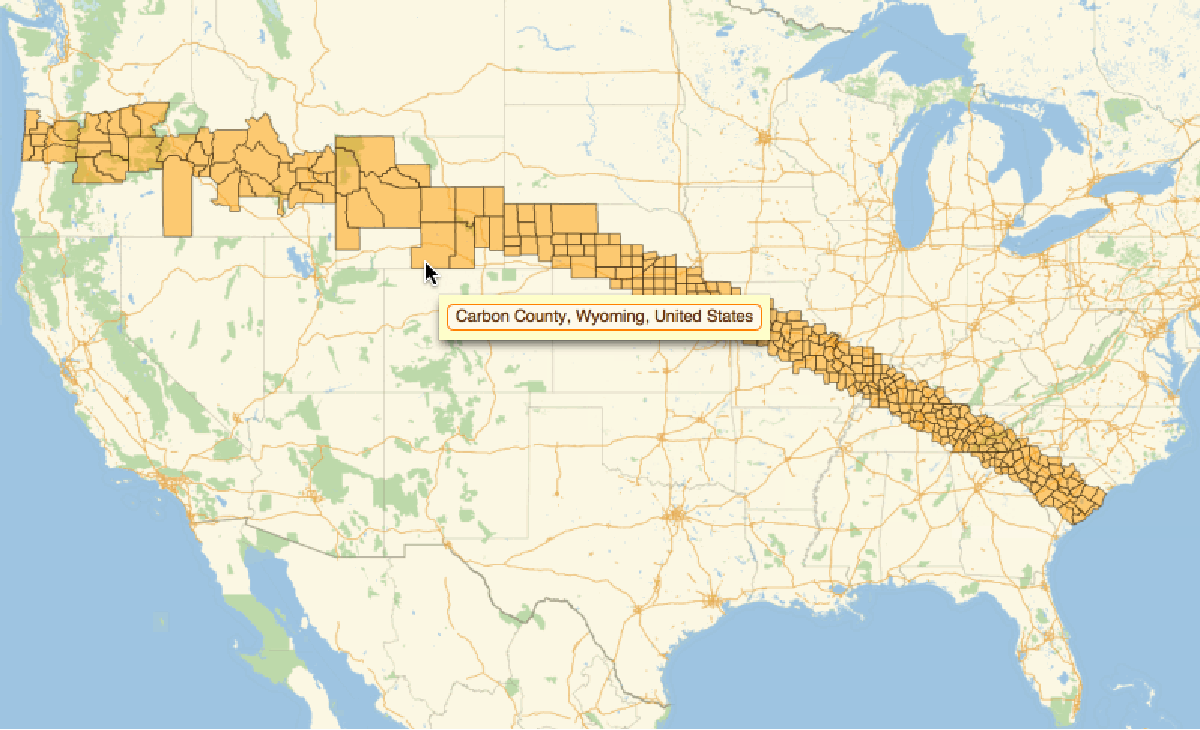
And here is the visual for the counties: (Animation is at the top)
usco=Cases[adus,Entity[_,{_,_,_}]];GeoListPlot[usco,ImageSize->800,GeoLabels->(Tooltip[#1,#2]&),GeoRange->{{25,49},{-125,-75}},GeoProjection->"Mercator"]
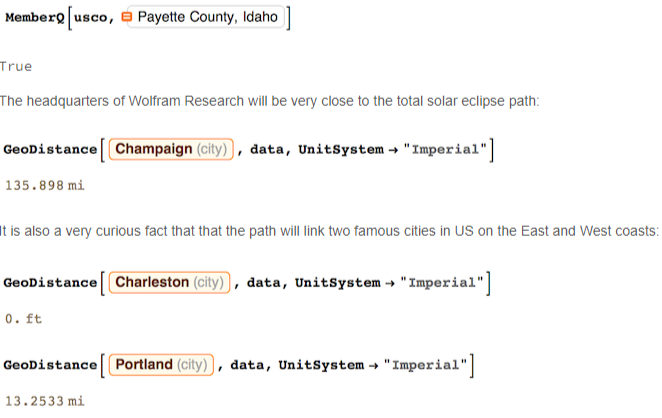
Check if your county is in the path:
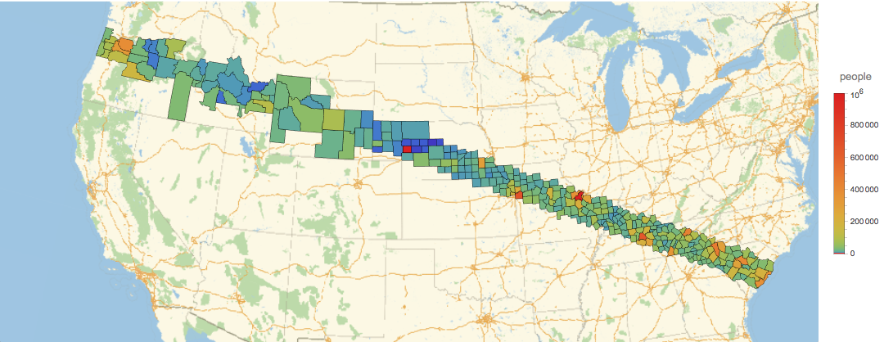
We could also color county polygons according to the population, to see where the major urban centers are and where most people will be exposed to the solar eclipse:
GeoRegionValuePlot[usco->"Population",ImageSize->1000,ColorFunction->(ColorData["Rainbow"][#^.2]&)]
But what I really would like to do is to compute average Cloud Cover for last few years above the counties and color the counties accordingly. That would show the probability of clear visibility of the eclipse. But I am not sure yet how to do that most efficiently. Let me know if you know ;)
CITE THIS NOTEBOOK
CITE THIS NOTEBOOK
Path of the total 2017 solar eclipse across US
by Vitaliy Kaurov
Wolfram Community, STAFF PICKS, 2015
https://community.wolfram.com/groups/-/m/t/465606
by Vitaliy Kaurov
Wolfram Community, STAFF PICKS, 2015
https://community.wolfram.com/groups/-/m/t/465606