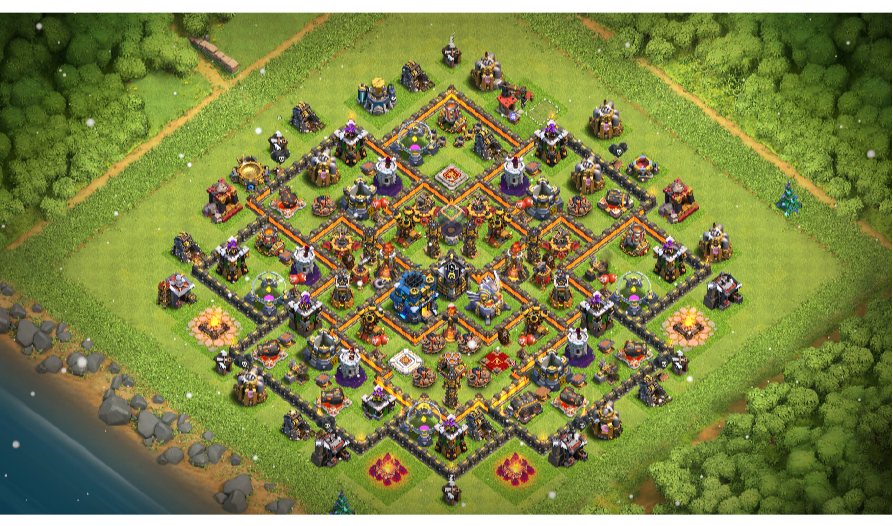
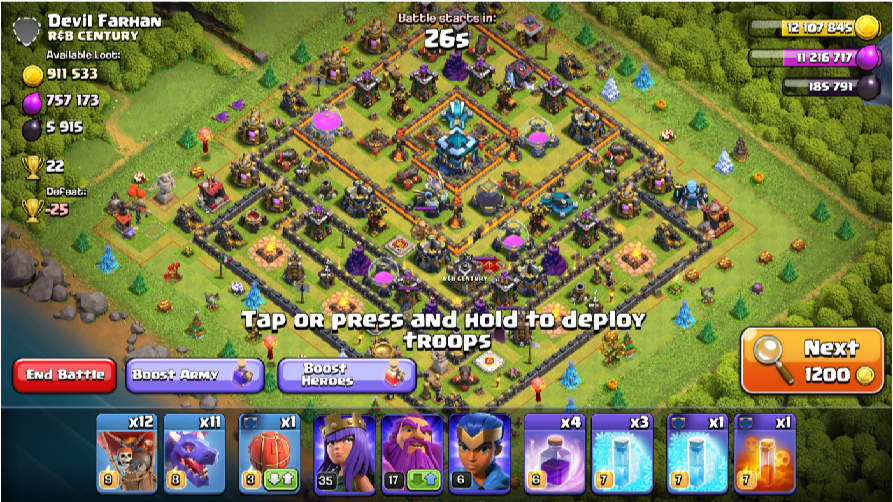
Clash of Clans (CoC) is a popular online mobile game. Players build and defend their own bases while attacking other players’ bases. One main feature of Clash of Clans is attacking enemy bases. Enemy bases have a finite amount of loot - some more than others - and are discovered randomly. The cost of discovering a new base penalizes players who are “greedy” and search through too many bases. As a lover of the game, I was wondering what is the loot threshold that players should strive for when attacking bases. Veteran players know that attacking the highest loot bases at any cost is the best strategy for acquiring loot - and we will see if we can verify this conclusion. This article will be focused on a similar base to myself. I am in Crystal III, ~1950 trophies, with a level 12 town hall, and a fairly average army left - an example clash of clans base. right - a clash of clans base that is discovered while raiding. This base has 911, 533 gold. Note: this is a fun project with deals with basic statistical analysis, and does not and should not promote in any way the collection of data, use of bots, or creation of tools that will violate Clash of Clan’s terms of service
Setup
Setup
Collecting data:
Collecting data:
I searched through 61 bases at my trophy range and recorded the amount of available gold in each base, in thousands.
In[]:=
goldvalues={242,652,469,137,165,500,52,728,435,558,408,255,695,296,225,427,200,111,123,198,518,354,517,134,160,169,321,116,520,641,281,410,477,560,169,543,83,617,186,436,301,348,768,247,445,168,48,456,361,441,45,856,422,593,350,1530,554,600,460,258};
Mean and Standard Deviation of gold values.
In[]:=
N/@{Mean[goldvalues],StandardDeviation[goldvalues]}
Out[]=
{388.983,248.646}
Histogram of gold values.
In[]:=
Histogram[goldvalues,18]
Out[]=
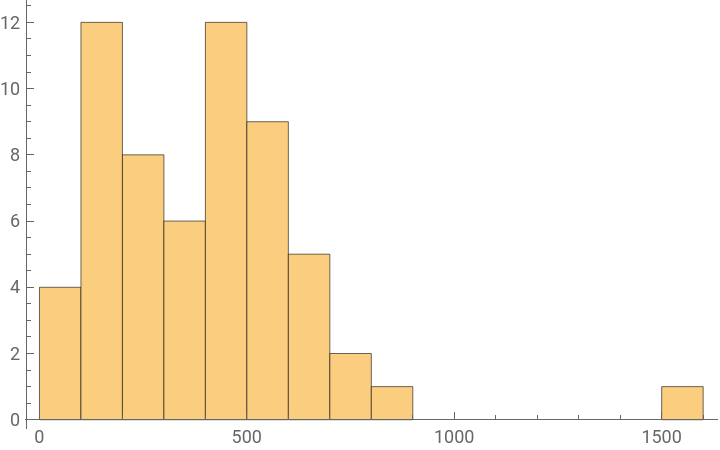
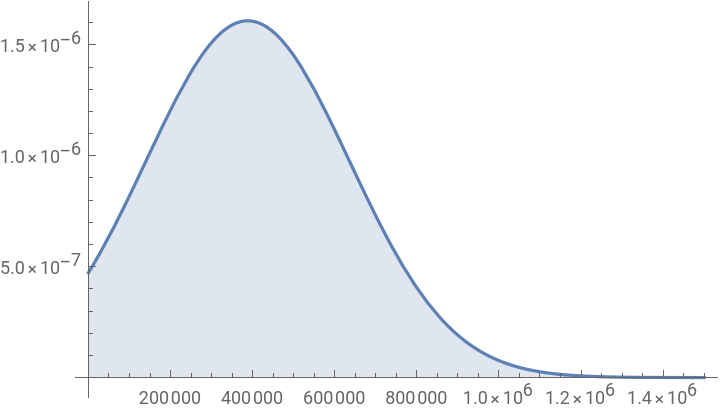
Assuming the data follows a Gaussian, which may not be justifiable because of player tactics, the dataset is best modeled by using a PDF generated from a normal distribution.
In[]:=
Plot[Table[PDF[NormalDistribution[388000,248000],x],{σ,{248000}}]//Evaluate,{x,0,1500000},FillingAxis]
Out[]=
Calculating discovery probabilities:
Calculating discovery probabilities:
Using the normal distribution, therefore, some base with gold G can be found with
probability
In[]:=
P[G_]:=Probability[x>=G,xNormalDistribution[388000,248000]]
Probability of finding a base with more than 300,000 gold
In[]:=
P[300000]
Out[]=
1
2
11
31
2
If a player skips through k bases, then, we would expect their probability of not finding a base with gold at least G to be:
In[]:=
P
kskips
If we want probability of failure to be less than 5%, then we to skip through k bases where k is such that k is the integer ceiling of the solution
In[]:=
NSolve[[300000,k]==.05,k]
P
kskips

Out[]=
{{k2.94307}}
At Town hall level 12, we have per raid the following profit model:
Finding a profit model:
Finding a profit model:
Given a gold threshold G, loot L, and the number of bases search through before raiding a base is N, we have:
In[]:=
LG-1100·N
Out[]=
LG-1100·N
Therefore, given a gold threshold G, our (minimal) expected loot from a given raid is
In[]:=
LootFunc[G_]:=G-1100*Ceiling[k/.NSolve[(1-N[Probability[x≥G,xNormalDistribution[388000,248000]]])^k.05,k,Reals]]
Expected loot from gold threshold of 300,000 gold
In[]:=
LootFunc[300000][[1]]
Out[]=
296700
Testing the Model
Testing the Model
Now we iterate over gold thresholds in increments of 100,000 from 100,000 to 1,100,000 to find the optimal base gold threshold. Players typically describe their raid amounts to other players in increments of 100,000 gold/elixir, so I made this choice accordingly.
In[]:=
results=Table[{i,LootFunc[i][[1]]},{i,100000,1100000,100000}]
Out[]=
{{100000,97800},{200000,196700},{300000,296700},{400000,394500},{500000,491200},{600000,584600},{700000,669200},{800000,732900},{900000,731700},{1000000,516000},{1100000,-509300}}
Profit function graphed from 100,000 to 1,100,000 in increments of 100,000
In[]:=
ListPlot[results,AxesLabel{G,L}]
Out[]=
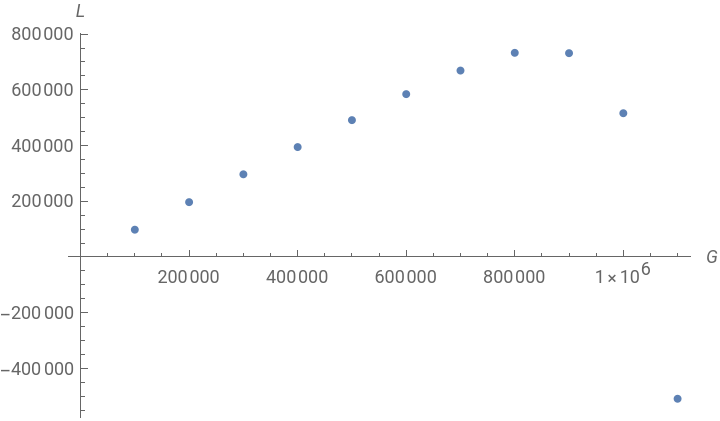
The profit function peaks around 800,000 - 900,000 gold, and is approximately linear from 200,000 - 800,000 gold. The profit function drops steeply off around a threshold of 1,000,000 gold. Around 1,100,00 gold, the profit is negative.
Conclusions
Conclusions
Therefore, this elementary model suggests players only attack other players who have approximately 800,000-900,00 gold available, as they stand to make the most profit, on average. In addition, raiding profit is linear up until a threshold of 800,000 gold. A weakness of this model is in the insufficient data I collected on the high end. My data only contains one data point over 1,000,000 gold, which caused modeling problems with the Gaussian function. The PDF generated from the normal distribution gives discovering a base with greater 1,400,000 gold a probability of near 0, wheras this ought to be much larger. This has implications on the profit model. In the profit function graph, a threshold of 1,100,000 has a negative profit value because my model deems the event of finding a base with this threshold so unlikely, that the -1100 x #number of bases becomes quite large. There is likely some credence to the profit function dropping off over 1,000,000. It seems weakness in the modeling limits us from knowing by what order of magnitude the drop off is significant in. In the general sense, it is also interesting to see whether to known if the data is Gaussian at all? We can make this assumption, but in reality, player tactics probably drive players to exhibit a dichotomy, where some players have enormous amounts of loot as they are in late-game for their respective town hall level, and other players are still upgrading as they are in the early game for their town hall level. Therefore, we might expect a more complex distribution.
I think a future addition to this project could be an extension of this profit function, that also takes into account the level of the enemy town hall and walls. It might also be meaningful to see if Clash of Clans players' loot amounts exhibit Benford's Law as a method of understanding the distribution of loot among players. The probabilistic strategy in CoC makes Clash of Clans an unlikely but interesting target for elementary statistical analysis.
I think a future addition to this project could be an extension of this profit function, that also takes into account the level of the enemy town hall and walls. It might also be meaningful to see if Clash of Clans players' loot amounts exhibit Benford's Law as a method of understanding the distribution of loot among players. The probabilistic strategy in CoC makes Clash of Clans an unlikely but interesting target for elementary statistical analysis.