The majority of earthquakes around the world can be found along continental plate boundaries, either due to divergent plate boundaries where new oceanic crust is generated, or at convergent plate boundaries where collisions and subduction can occur. Earthquakes can also be caused by the motion of magma below the surface as it moves, melts, and displaces native rock causing it to break, but these are usually smaller earthquakes and often aren’t recorded at the same level of detail around the world as stronger earthquakes.
The Earth’s crust is broken up into plates. Denser basaltic rocks are more mafic, composed of heavier minerals containing iron and magnesium, and make up the bulk of oceanic crust. Continental crust is more felsic, containing more silicon, and “floats” on top due to its lower density. As the plates are jostled around, pressure builds and something has to give. Denser oceanic crust tends to then subduct under less dense continental crust. This sinking action of denser material, known as “slab pull”, is one of the primary drivers of continental drift. As the colder, hydrated minerals of oceanic crust subducts, it pulls the entire plate and the continental crust along for the ride. New oceanic crust is formed at oceanic ridges like the mid-Atlantic ridge and involves a certain level of force called “slab push”, but the force from “slab pull” subduction is a more significant driving force.
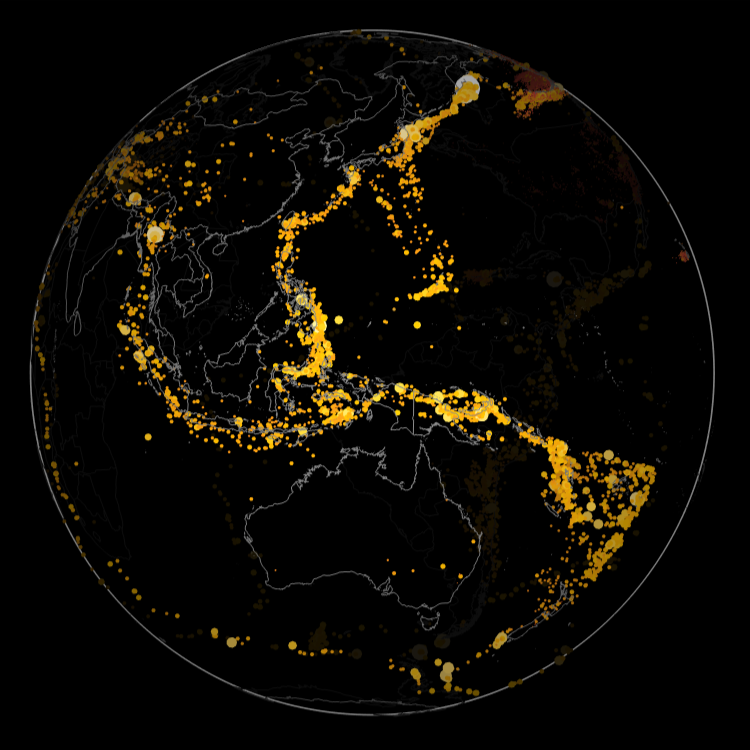
Whether the plates are subducting, forming, or grinding past one another, earthquakes form. News and media often covers earthquakes, but it doesn’t always talk about the depth of earthquakes, preferring to focus only on the surface effects and where the epicenter is. But if you plot earthquakes around the world and include depth, you can see that many earthquakes, especially in the western Pacific, are quite deep as a result of the Pacific plate subducting under other plates. By exploring curated earthquake data, you can see how the depth varies worldwide as the Earth rotates.
First, query for all earthquakes in 2025 with magnitude between 2 and 10:
In[]:=
data=EarthquakeData[All,{2,10},{{2025,1,1},{2025,12,31}}];
Count the number of earthquakes retrieved:
In[]:=
Length[data]
Out[]=
27464
Extract the magnitude, position and depth from the full data:
In[]:=
props=Lookup[#,{"Magnitude","Position","Depth"}]&/@data;
Convert the position to Cartesian coordinates and the depth, both in meters:
In[]:=
triples0={#[[1]],GeoPositionXYZ[#[[2]]][[1]],QuantityMagnitude[#[[3]],"Meters"]}&/@Normal[props][[All,2]];
Bin the triples into groups of 0.1 magnitude and subtract the depth, exaggerated by 2.5 times, from the surface location to make the depth more visible at this scale:
In[]:=
triples={Round[#[[1]],0.1],#[[2]](Norm[#[[2]]]-2.5#[[3]])/Norm[#[[2]]]}&/@triples0;
Calculate the range of earthquake magnitudes found in the retrieved data:
In[]:=
range=MinMax[triples[[All,1]]]
Out[]=
{2.,8.8}
Query for the bounding polygons for all countries, including their outlying areas, to use as a more recognizable location reference:
In[]:=
polys=EntityValue["Country",GeoVariant["Polygon","AllAreas"]];
Convert the polygons to 3D lines and apply normals that radiate from the origin:
In[]:=
lines=Line[#[[1]],VertexNormals->#[[1]]]&/@(Flatten[GeoBoundary[polys]/.JoinedCurve->Identity]/.gp_GeoPosition:>GeoPositionXYZ[gp]["Data"]);
Group the earthquakes by magnitude, apply size and color and apply normals that radiate from the origin:
In[]:=
points=KeyValueMap[{Blend[{StandardRed,StandardYellow,White},Rescale[#,range]],PointSize[#^3/20000],Point[#2,VertexNormals->#2]}&,GroupBy[triples,First->Last]];
Grouping the points optimizes rendering time by reducing the number of primitives needed from 26,953 to only 61:
In[]:=
Length[points]
Out[]=
61
Assemble a 3D graphics scene:
In[]:=
gr=With[{t=3Pi/4},Graphics3D[{Inset[Graphics[{Gray,Circle[]}],{0,0,0},Automatic,ImageScaled[.952]],points,GrayLevel[.5],lines},Background->Black,Boxed->False,SphericalRegion->True,ViewAngle->Pi/12,Lighting->{AmbientLight[GrayLevel[.1]],DirectionalLight[White,ImageScaled[{0,0,1}]]},ViewPoint->4{Cos[t],Sin[t],0},ImageSize->450]]
Out[]=
A video can be generated if you are patient for each frame to be rendered:
In[]:=
AnimationVideo[Show[gr,ViewPoint->4{Cos[t],Sin[t],0},ImageSize->450],{t,0,2Pi},RasterSize->450,DefaultDuration->15]
Out[]=
Subduction zones are often correlated with explosive volcanoes. As the hydrated minerals in the subducting oceanic crust dives beneath continental crust, the water lowers the melting point of surrounding silicate bearing rock allowing lighter melted material to rise to the surface. These silicate rich magmas are very thick containing lots of gas and results in explosive volcanoes.
Over time more earthquakes will appear, but they will very likely appear along the clusters of earthquakes shown in these visuals. The visible clustering of earthquakes defines the plate boundaries. On rare occasions, earthquakes can happen in the middle of a plate, sometimes as a result of a mantle plume or by the reactivation of ancient and dormant faults. Good examples of this type of earthquake are those found in the New Madrid, Missouri area in the central United States. These old faults are more unpredictable and capable of very strong but infrequent quakes.
Building codes near plate boundaries include safety measures to better withstand frequent earthquakes. Building codes far from plate boundaries often take a cheaper approach and avoid such safety features as they are unlikely to be necessary … until they are. If a strong earthquake happens far from a plate boundary, its likely to cause far more damage from building collapses and other structural damage. In addition, the continental crust that is far from plate boundaries tends to be more solid having note been broken up by repeated earthquakes and grinding of other plates so the shockwaves of these earthquakes travels over a large distance in these areas. Measuring earthquakes worldwide can help in the civil engineering plans of human occupied areas, but often economics and the tendency to build cheap are good in the short run, but can be devastating in the long run.
CITE THIS NOTEBOOK
CITE THIS NOTEBOOK
Global 3D depth-magnitude distribution of 2025 earthquakes
by Jeffrey Bryant
Wolfram Community, STAFF PICKS, December 22, 2025
https://community.wolfram.com/groups/-/m/t/3595292
by Jeffrey Bryant
Wolfram Community, STAFF PICKS, December 22, 2025
https://community.wolfram.com/groups/-/m/t/3595292