Functions Definitions
Functions Definitions
Get World data from ECDC
Get World data from ECDC
In[]:=
getDataWorldTable // ClearAllgetDataWorldTable[date_String]:= getDataWorldTable[date] = Module[{url, assencialHeads, originalHeads, newHeads, file, r}, url = "https://www.ecdc.europa.eu/sites/default/files/documents/COVID-19-geographic-disbtribution-worldwide-"<>date<>".xlsx"; r = First@Import[url]; r = AssociationThread[First@r #]&/@Rest@r; r = SortBy[r, {Key["countriesAndTerritories"], Key["dateRep"]}]; rAll, "deathPPM" = #deaths#popData2018 &/@r; rAll, "deathAcc" = GroupBy[r, Key["countriesAndTerritories"] Key["deaths"], Accumulate]//Values//Flatten; rAll, "deathAccPPM" = #deathAcc#popData2018 &/@r; rAll, {"dateRep", "cases","deaths","countriesAndTerritories","popData2018"}; Dataset[r]](*dataWorld = getDataWorldTable["2020-06-15"];*)
6
10
6
10
Get Top 20 Countries by Death
Get Top 20 Countries by Death
In[]:=
createPivotTop20[dataWorld_]:= Module[{dataWorldTop20, top20CountriesByDeath, r}, top20CountriesByDeath = dataWorld[GroupBy["countriesAndTerritories"], Last, "deathAcc"]//ReverseSort//Query[;;20]//Normal//Keys; dataWorldTop20 = dataWorld[Select[MemberQ[top20CountriesByDeath, #countriesAndTerritories]&&(#dateRep > DateObject["2020-03-15"])&]]; r = dataWorldTop20[GroupBy["countriesAndTerritories"], GroupBy["dateRep"], First,"deathAccPPM"][Map[KeySort]]; r = r[All, KeyMap[DateString[#, {"Year","-","Month","-","Day"}]&]]//Normal; r = AssociationThread[Keys@r KeyUnion[Values@Normal@r, Missing[]&]]; r = ReverseSortBy[r, Last@*DeleteCases[Missing[]]]; r](*pivotWorldTop20 = createPivotTop20[dataWorld]*)
HeatMap Plot
HeatMap Plot
In[]:=
fillBlancks[data_]:= SequenceReplace[#,p:{x_?NumberQ,Repeated[Missing[]]} Splice@Table[x, Length@p] ]&/@(data//Values//Values)
In[]:=
createArrayPlot[data_]:= Module{plot, max, legend, weekStart}, max = data//Values//Values//Flatten//DeleteCases[Missing[]]//Max//IntegerPart; legend = BarLegend[{"TemperatureMap",{0,max}}, LegendLabel"Deaths by Million/Habitants ",LabelStyleDirective[FontSize12,Gray], LegendLayout"Row"]; weekStart = Mod[Length@data〚1〛,7,1]; plot = ArrayPlotMap[Log[#+1]&,fillBlancks[data] , {-1}] , ColorFunction"TemperatureMap" , MeshTrue ,MeshStyleOpacity[0.1] ,Frame->True ,FrameStyle->Opacity[0] ,FrameTicksStyleOpacity[1] , FrameTicks MapIndexed[{First@#2, Row@{StringReplace[#1, "_" " "]," [",IntegerString[First@#2, 10,2],"]"}}&, Keys@data] ,MapIndexed[{First@#2, Row@{IntegerString[IntegerPart@#1,10,3], Style[" Deaths/MM hab.", 8]}}&, Last/@DeleteCases[Missing[]]/@data//Values] , MapIndexed[{First@#2, DateString[#1, {"Day","/", "Month"}]}&, Keys@data〚1〛]weekStart;;;;7 , None ,Epilog -> Inset[ Panel[Column[ Style["painel.covidradar.org.br", 18, White, Bold] , Style["by looqbox", 17, White, Bold] , AlignmentLeft],Appearance"DialogBox"] , Scaled[{.23,.1}] ] , ImageSize800 , DataReversedFalse , AspectRatio 0.8 , BaseStyle{"FontFamily" "Helvetiva", FontSize 12} , PlotLabelStyle["Top 20 Countries by absolute Covid-19 death number\nsorted by Deaths/MM of Habitants until "<>Last@Keys@data〚1〛, 20,Bold] ; Column[{plot, Row@{legend, StringRepeat[" ", 31]}}, AlignmentRight](*createArrayPlot[pivotWorldTop20]*)
Executing Code
Executing Code
In[]:=
dataWorld=getDataWorldTable["2020-06-16"];
In[]:=
pivotWorldTop20=createPivotTop20[dataWorld];
In[]:=
arrayplot=createArrayPlot[pivotWorldTop20]
Out[]=
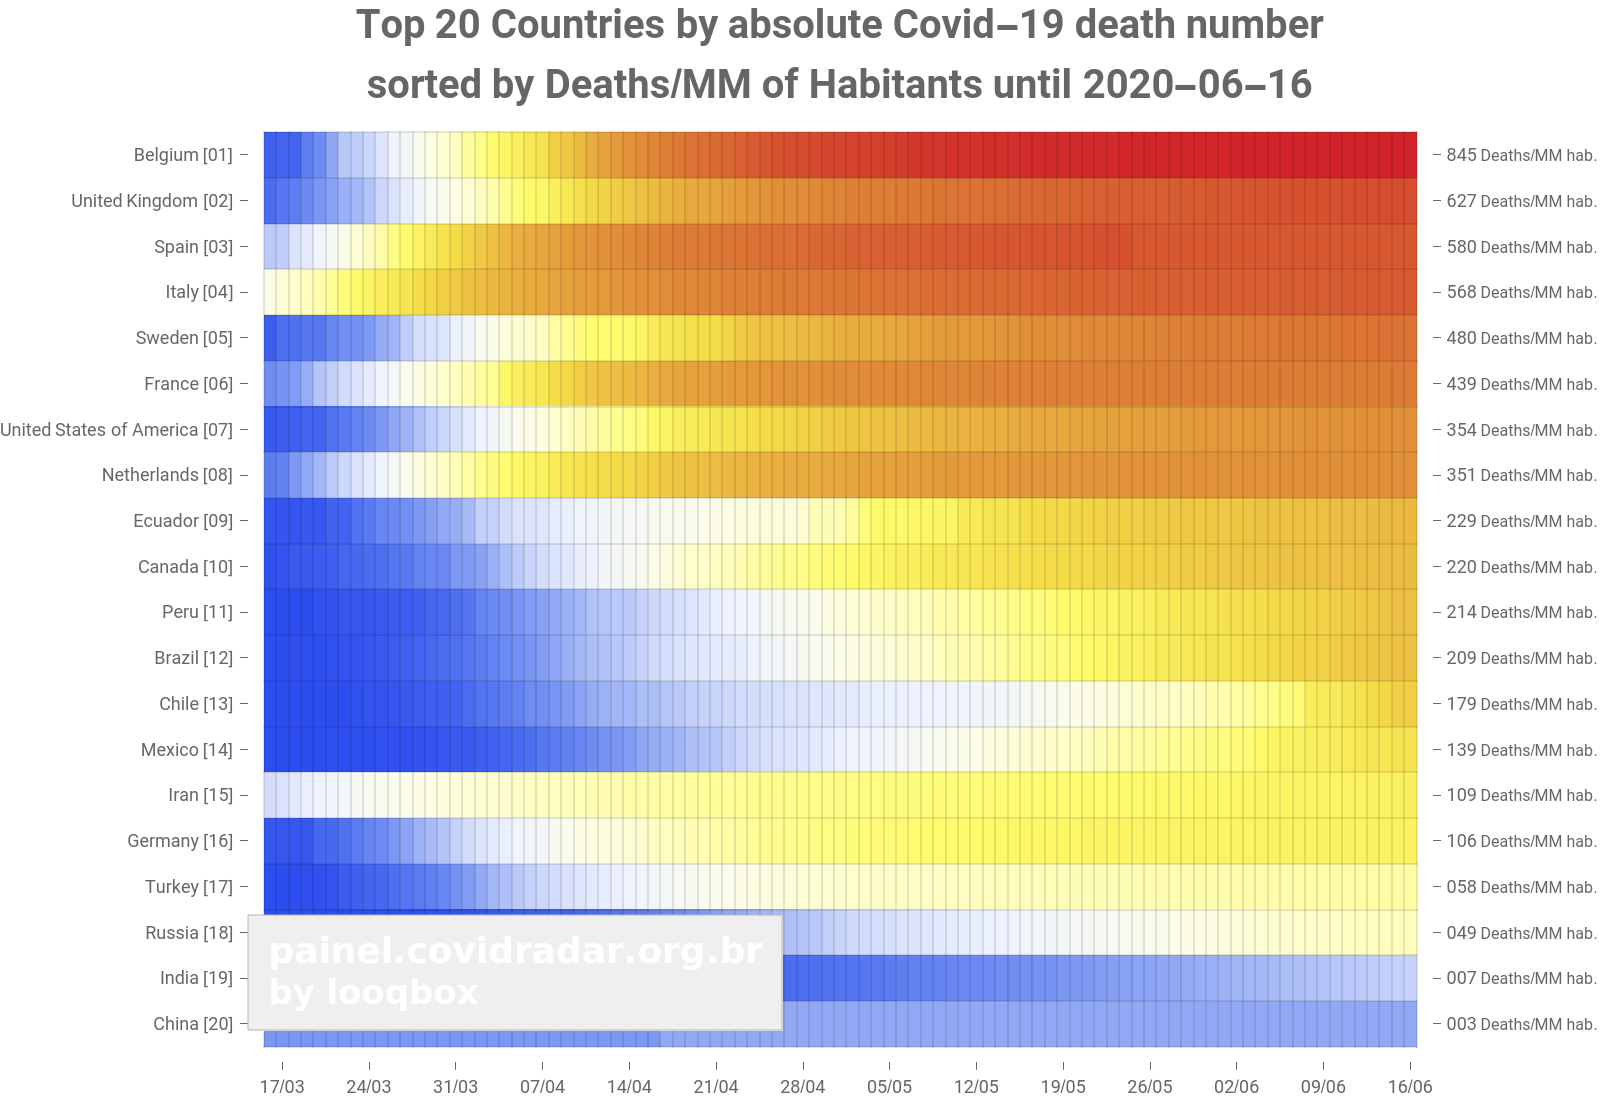

(*SystemOpen@Export["heatMap.png",arrayplot]*)