Graphing Derivatives
Graphing Derivatives


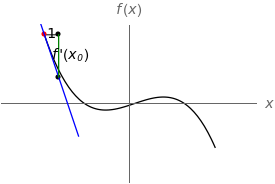
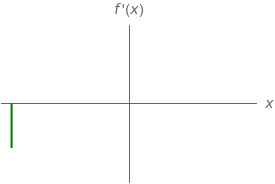
This Demonstration illustrates the connection between a function and its derivative on two separate graphs. The green vertical bars indicate the value of the rate of change at the point of tangency.
External Links
External Links
Permanent Citation
Permanent Citation
Joshua Fritz, Chad Pierson, Angela Sharp
"Graphing Derivatives"
http://demonstrations.wolfram.com/GraphingDerivatives/
Wolfram Demonstrations Project
Published: September 20, 2007