Language is the fundamental basis of modern human communication. Even the most diverse arrays of languages are tied together by shared origins in what is called a language family. Between closely related languages, linguistic patterns can be pinpointed and extrapolated, including N-grams. N-grams are sequences of n number of items in a specific order, and within a word, these items are letters. This project aims to analyze the composition and placement of common N-grams within words of the Indo-European language family. By detecting these N-grams, the part of speech for given words can be predicted. The project implements algorithms to identify N-grams and calculates probabilities for different parts of speech based on their presence and position in words. These calculated values are then visualized through various graphical representations to facilitate deeper analysis and understanding of linguistic patterns across related languages.
Introduction
Introduction
All words in alphabetical languages are unique sequences of letters, or N-grams. However, certain N-grams are far more common within a language than others. Increased commonality may be because certain letter sequences are more easily pronounced by speakers, and are therefore more phonetically accessible. Orthographic conventions, which are spelling-related, may also dictate N-gram frequency (e.g. the letter “q” has very few word instances where it is not followed by “u”). Additionally, morphological structures, or the formation of words, may lead to a prevalence of certain N-grams, such as “ing” and “ed,” which are N-gram verb endings that indicate tense. Extracting N-gram occurrences helps identify how the aforementioned etymological contextualization of a word affects it as a whole in terms of its place within a sentence, within a language, and within a language family.
I started by looking at the most common N-grams, focusing on bigrams (two letter sequences) and trigrams (three letter sequences) and their appearances in words in various languages. Initially, I considered using machine learning to determine the part of speech based on these N-grams. However, I opted for a statistical approach instead. This method provides a more nuanced understanding and precise classification of parts of speech and makes for effective visualizations.
Understanding N-Grams
Understanding N-Grams
Data Collection
Data Collection
To start, I determined what languages to implement and collected data on each language, mostly from Wikipedia frequency lists. Due to limitations in Wolfram’s capabilities regarding certain languages, I settled on a total of twelve languages: English, Danish, German, Dutch, Swedish, Spanish, French, Italian, Portuguese, Russian, Polish, Hindi. These languages represent a range of four major branches, or subfamilies, within the Indo-European language family: Germanic, Romance, Slavic, and Indo-Iranian.
N-Gram Data
N-Gram Data
First, I created lists of the 40-50 most common bigrams and trigrams in each language.
Defining iconized lists for each languages’ N-grams:
In[]:=
nGramsEng=;nGramsDan=;nGramsGer=;nGramsDut=;nGramsSwe=;nGramsSpa=;nGramsFre=;nGramsIta=;nGramsPor=;nGramsRus=;nGramsPol=;nGramsHin=;
Word Data
Word Data
When I first approached the project, I had some trouble deciding where to get text from for my word data. This will be crucial later when searching for N-gram occurrences within their associated languages. I needed words to represent a language as a whole, so they had to be both extensive and generalized. I initially used text from the Wolfram Data Repository, then quickly ran into issues because much of the text is dated and uses old vocabulary. I then moved onto Wolfram’s built in word lists, but these could contain anywhere from about 10,000 words to 150,000 words, which took too long to process. Finally, I simply used ~1000 of the most common words in each language.
Defining iconized lists for languages’ most frequent words:
In[]:=
engWords=ToString/@;danWords=ToString/@;gerWords=ToString/@;dutWords=ToString/@;sweWords=ToString/@;spaWords=ToString/@;freWords=ToString/@;itaWords=ToString/@;porWords=ToString/@;rusWords=ToString/@;polWords=ToString/@;hinWords=ToString/@;
Data Organization
Data Organization
I organized all twelve languages’ data to make it easy to work with in the future.
Putting the languages into a list:
In[]:=
languages={"English","Danish","German","Dutch","Swedish","Spanish","French","Italian","Portuguese","Russian","Polish","Hindi"};
Associations with the languages as the keys are useful since it allows their correlating values to be referenced easily.
Creating an association between languages and their words:
In[]:=
allLangText=<|"English"->engWords,"Danish"->danWords,"German"->gerWords,"Dutch"->dutWords,"Swedish"->sweWords,"Spanish"->spaWords,"French"->freWords,"Italian"->itaWords,"Portuguese"->porWords,"Russian"->rusWords,"Polish"->polWords,"Hindi"->hinWords|>;
Creating an association between languages and their N-grams:
In[]:=
allLangNGrams=<|"English"->nGramsEng,"Danish"->nGramsDan,"German"->nGramsGer,"Dutch"->nGramsDut,"Swedish"->nGramsSwe,"Spanish"->nGramsSpa,"French"->nGramsFre,"Italian"->nGramsIta,"Portuguese"->nGramsPor,"Russian"->nGramsRus,"Polish"->nGramsPol,"Hindi"->nGramsHin|>;
Sometimes, it may be easier to work with a list instead of an association.
Function for converting an association to a list:
In[]:=
ascToList[assoc_Association]:=List@@@Normal[assoc]
Visualization
Visualization
In order to gain an initial understanding of Indo-European N-grams, I decided to look at the basic N-gram data as a whole. All Indo-European languages originated from the Proto-Indo-European language, which branched off into proto-languages: Indo-Iranian (Indic), Hellenic (Greek), Celtic, Italic (Latin), Balto-Slavic, and Germanic. Consequently, many languages use similar alphabets and therefore share common N-grams. Knowing the most prevalent N-grams can help determine what sounds and phrases are most ubiquitous in the Indo-European language family.
Compiling a list of all the N-grams throughout the twelve languages:
In[]:=
allNGrams=Flatten[{nGramsEng,nGramsDan,nGramsGer,nGramsDut,nGramsSwe,nGramsSpa,nGramsFre,nGramsIta,nGramsPor,nGramsRus,nGramsPol,nGramsHin}];
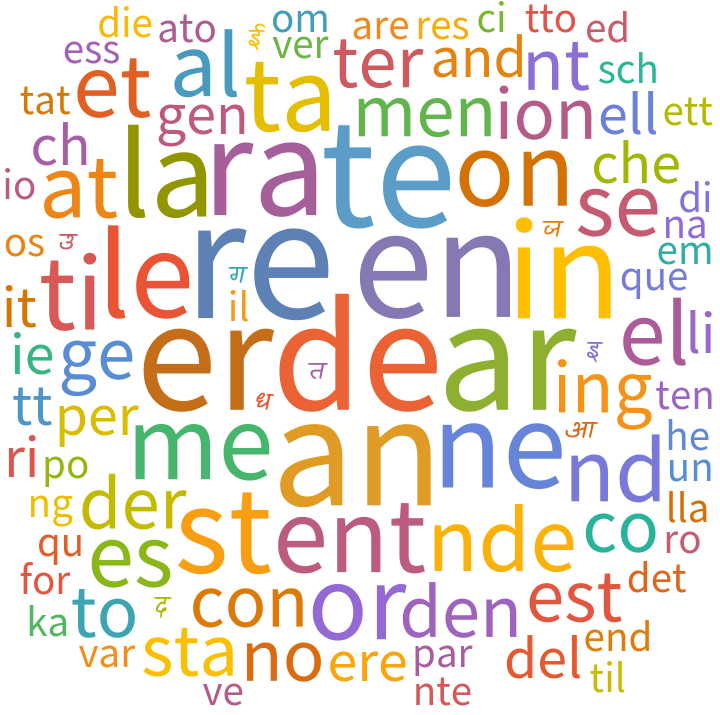
The first visualization I created is a basic word cloud of all the N-grams based on frequency.
Generating a word cloud:
In[]:=
WordCloud[allNGrams]
Out[]=
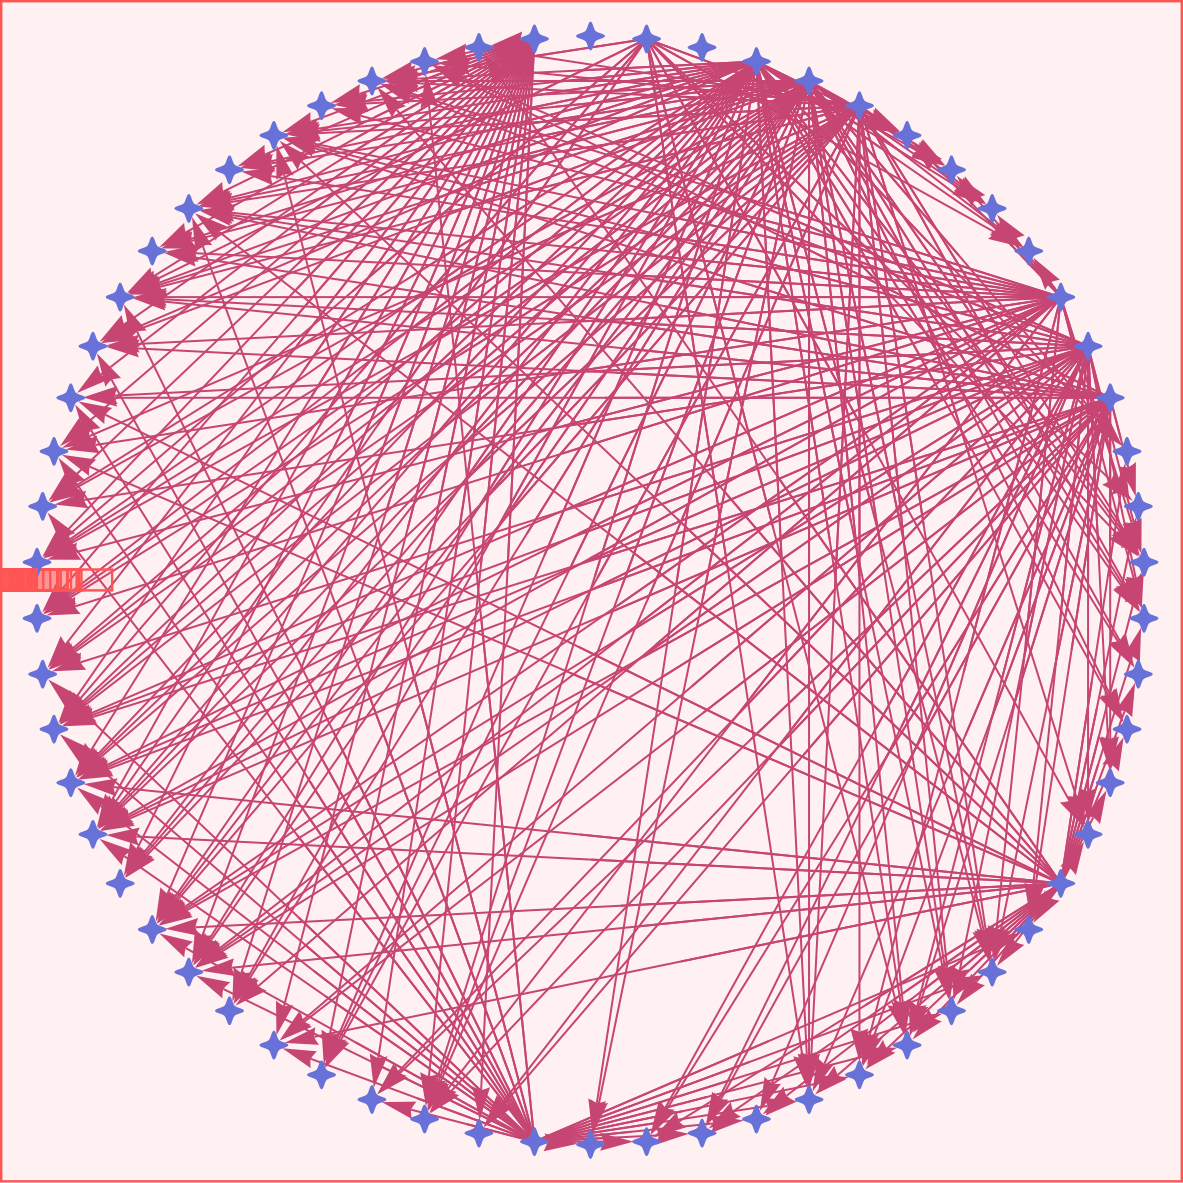
Next, I connected the 50 most commonly occurring Indo-European N-grams to the languages they frequent. This helps to identify what languages are the most universal within their family.
Using Commonest to find the 50 most common N-grams:
In[]:=
commonestNGrams=Commonest[allNGrams,50]
Out[]=
{and,ent,ing,ion,nde,men,in,en,nt,re,er,an,ti,es,on,at,se,nd,or,ar,al,te,co,de,to,ra,et,it,ge,le,me,st,el,ne,li,den,der,ere,ch,ie,la,ta,ri,che,gen,ter,no,con,est,sta}
A function that outputs the N-grams a language shares with the top 50 N-grams:
In[]:=
findInCommon[language_String]:=Part[Select[Tally@Flatten[{allLangNGrams[[Key[language]]],commonestNGrams}],Part[#,2]>1&],All,1]
I used directed edges (arrows) to represent direction in my graph. An arrow from a language to an N-gram indicates that it features that N-gram often.
Function that creates a directed edge relationship:
In[]:=
directEdge[language_String,word_String]:=languageword
The languages and N-grams are represented as vertices:
In[]:=
vertices=Flatten[{languages,commonestNGrams}];
The edges are the directed edge relationships:
In[]:=
edges=Flatten[Table[directEdge[lang,common],{lang,languages},{common,findInCommon[lang]}]];
After I identified the vertices and edges in the graph, I represented it with a “CircularEmbedding” graph, which places all the vertices along the outer circumference of a circle and draws the edges between points as chords spanning the circle. After some stylization, this resulted in a network-style graph that makes relationships easily traceable.
Graphing the final circle:
In[]:=
graph=Graph[vertices,edges,VertexLabels->"Name",GraphLayout->"CircularEmbedding",VertexShapeFunction->"ConcaveDiamond",PlotTheme->"RoyalColor"];GraphPlot[graph]
Out[]=
Predicting Parts of Speech
Predicting Parts of Speech
Now that N-gram relationships are understood, they can be applied to predicting parts of speech. Being able to predict parts of speech by words’ N-gram composition can have many linguistic applications. It can be used to fine-tune large language models (LLMs) and natural language processing (NLP) applications, especially in diverse linguistic contexts. It can also provide insights about shared and unshared characteristics between related languages, producing more robust language models.
Language Identification
Language Identification
In order to find appropriate N-grams when a word is inputted, the language of the word must be detected to search through the correlating N-gram list. This function checks if any of the implemented languages’ word lists contain the word to determine if it is in the language.
Function that outputs a list of languages the word could be in:
Once the language is detected, this function compares the word to the N-grams in its language to select the N-grams that it contains.
Function that outputs a list of N-grams a word contains:
A graph can be used to model the word and its N-grams’ places within the Indo-European language family tree. This language graph detects the languages and N-grams of a word, then draws directed edges to represent the relationship flow as the family tree branches out.
Function to generate a language family tree with a word incorporated:
This graph can be applied to model relationships between languages using cognates, which are words in different languages that share a linguistic ancestor and are therefore very similar.
For example, the word “radio” originated from the Latin word “radius,” meaning “spoke of a wheel, beam of light, ray.” This origin is distinctly visible since all Romance languages (which are derived from Latin) modeled here use the word. It is also clear that the creation of the term radio spread to other Indo-European branches, leading to its modern-day commonality.
Generate language family graph of “radio”:
Probability Calculation
Probability Calculation
Since N-grams and language have been identified, I can calculate the part of speech probabilities for each word. There are nine identifiable parts of speech: adjectives, nouns, verbs, adverbs, pronouns, prepositions, conjunctions, interjections, and determiners. First off, the occurrences of the N-gram in the language’s text are identified. From there, each occurrence must be translated into English to use the built in PartOfSpeech function. The total amounts of each part of speech of the N-gram containing words are tallied and added up. However, not every word is available to translate with Wolfram and will be marked as Missing. These words are cleaned out of the data and the occurrences are divided by the total words detected to generate a list of probabilities. In order to standardize the values in each dataset calculated, when there are no detected words found with a certain part of speech, the part of speech is added into the dataset with a probability of 0 and the entire dataset is ordered alphabetically.
Function that outputs the part of speech probabilities of words containing a certain N-gram:
Now that the words’ part of speech probabilities can be calculated, the prediction can be more accurate by also analyzing the position of the N-gram within a word. This function uses pattern matching to determine whether the N-gram in a word is at the beginning, middle, or end, then only identifies word occurrences that follow the same pattern.
Function that incorporates position into probability calculations:
Example that calculates probabilities based on “ión” in “estación”:
Prediction Visualization
Prediction Visualization
The calculated probabilities can now be visualized. I decided to create a variety of types of graphs, so that depending on what is being analyzed, the appropriate graph can be selected for clarity and depth.
Bar charts are useful for precisely visualizing datasets. They are easy to read and N-gram probabilities can be quantified and compared very quickly.
Function to generate a bar chart:
Example with “hablar,” Spanish for “to talk”:
Density plots are an excellent way to visualize the distribution and frequency of N-grams within language data, providing clear insights into patterns and trends.
Function to generate a density plot:
Example with “विमान,” Hindi for “airplane”:
A matrix plot makes comparing all the probabilities at once easy by displaying everything together in a grid format.
Function to generate a matrix plot:
Example with “verantwoordelijkheid,” Dutch for “responsibility”:
Averaging and blending the vertical columns of the matrix plot together allows for an easy overview of the highest part of speech probabilities.
Function to generate an averaged matrix plot:
Example with “verantwoordelijkheid” again:
With so many different data visualizations, it was necessary to organize them into a usable structure. Thus, I developed a comprehensive graphic user interface with all the graph generating functions using Manipulate. This makes the program more user-friendly and interactive. The interface allows users to input any word in one of the twelve supported languages through a dynamically updating input field. The program automatically detects the potential languages for the entered word and displays them as selectable buttons. Once the user has selected their word and intended language, they can display a graph chart of their choice by selecting a dropdown option. Available options are a bar chart, language graph, list density plot, blended matrix plot, or unblended matrix plot, with all the options kept together using Switch. The user can reset the interface at any time using the reset button, which re-initializes the program with null values. The example graphs shown above are all generated on the interface.
Analysis
Analysis
Since the relationships between a word’s part of speech and its N-grams (given a particular language) can now be modeled, graphs can now be generated and applied to analyze how these relationships connect different Indo-European languages. I approached this by analyzing the effects on part of speech that a shared N-gram can have.
With common occurrences in ten languages of the twelve implemented languages, “re” is the most common N-gram. It is highly prevalent in both Germanic and Romance languages.
Finding the most common N-gram:
Next, I looked for the most common words with “re” at the beginning, middle, and end for English, Danish, and French. English serves as a baseline because although it is a Germanic language, it is heavily influenced by Romance languages as well (particularly French) and has inherited much of its vocabulary from Latin. I compared it to Danish, a Germanic language, and French, a Romance language.
I used blended matrix plots to visualize the part of speech probabilities because they make it easy to tell what the highest probabilities are.
Generating blended matrix plots for words beginning with “re”:
Generating blended matrix plots for words with “re” in the middle:
Generating blended matrix plots for words ending with “re”:
Next, I took all the matrix plots and put them together in a grid for easy analysis.
Putting graphs together into a grid:
This investigation with “re” reveals some vulnerabilities within the algorithm. Though the parts of speech of “result,” “reste,” “three,” and “være” were properly identified, the algorithm was not completely accurate when predicting other words. It largely leaned towards predicting nouns, potentially due to the disproportionately large number of nouns in every language. Results may have been skewed because of this. For example, the French word “être,” meaning “to be,” is a verb but had a slightly higher predicted probability of being a noun. Additionally, the predicted probabilities between English and French were far more similar than when compared to Danish. This indicates how within a language family, even when two languages aren’t in the same branch, N-grams that are extremely important to word composition can demonstrate interconnectedness.
Conclusion
Conclusion
This project develops a linguistics tool that integrates language detection, N-grams, and morphology. It makes statistical analysis easy and leverages various data visualizations in a convenient graphic user interface, fostering a deeper understanding of connections between Indo-European languages and word patterns. The predictions made throughout this project demonstrate a distinct correlation between N-grams in words and their part of speech, but they are not fully accurate. There are numerous ways to improve the project later on.
Extensions
Extensions
In the future, I would like to incorporate more languages in the Indo-European family and eventually, other language families. I also want to improve the efficiency of my functions so that they run faster and therefore can process larger datasets. This would also allow my graphic user interface to run faster. I could also incorporate machine learning techniques and utilize heatmaps and network graphs so that there could be more multilingual graphs, instead of just centering around one language at a time. I’d also like to implement a semantic analysis (the meaning of words) based on N-grams. Finally, it would be interesting to convert languages to the IPA (International Phonetic Alphabet) so that I could look at phonetic N-grams.
Acknowledgements
Acknowledgements
Thank you to my mentor, Jesús Adrián Montesinos Correa for guiding me throughout my project. I would also like to thank the WSRP staff, especially all the TAs who helped me develop my project and debug my code.
References
References
◼
Letter frequencies. (n.d.). University of Notre Dame. https://www3.nd.edu/~busiforc/handouts/cryptography/Letter%20Frequencies.html
◼
Trost, S. (n.d.). Syllable frequencies. https://www.sttmedia.com/syllablefrequencies
◼
Wiktionary:Frequency lists. (n.d.). Wiktionary. https://en.wiktionary.org/wiki/Wiktionary:Frequency_lists
CITE THIS NOTEBOOK
CITE THIS NOTEBOOK
Analyzing N-gram distribution within language families
by Elizabeth Chung
Wolfram Community, STAFF PICKS, July 12, 2024
https://community.wolfram.com/groups/-/m/t/3216607
by Elizabeth Chung
Wolfram Community, STAFF PICKS, July 12, 2024
https://community.wolfram.com/groups/-/m/t/3216607