Hydrogen recovery from purge stream of ammonia plant :
concentration of impurities in permeate stream vs. stage cut
Authors: Housam Binous and Ahmed Bellagi
Hydrogen recovery from purge stream of ammonia plant :
concentration of impurities in permeate stream vs. stage cut
Authors: Housam Binous and Ahmed Bellagi
concentration of impurities in permeate stream vs. stage cut
Authors: Housam Binous and Ahmed Bellagi
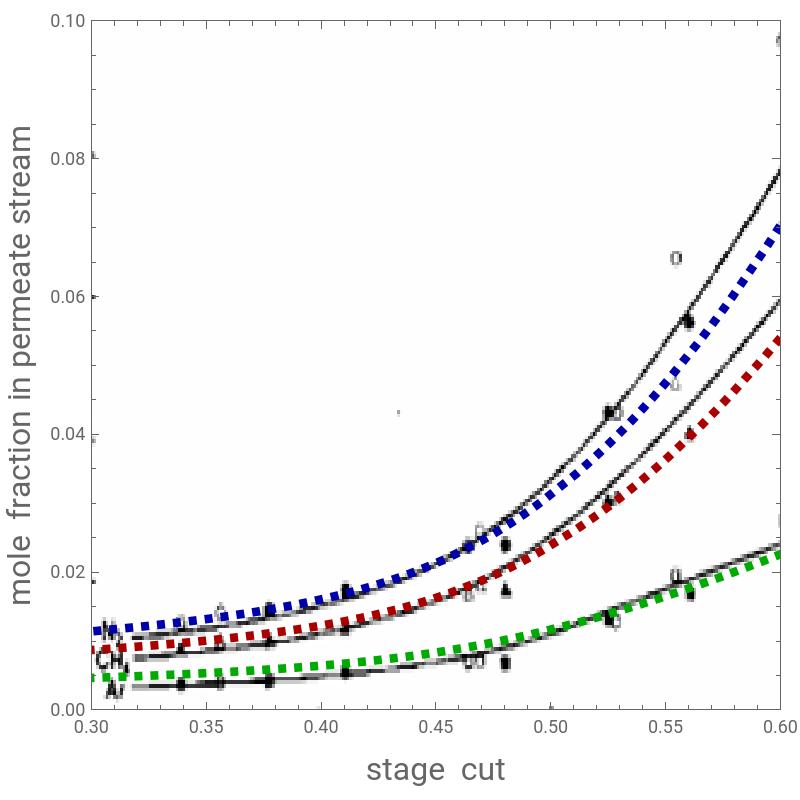
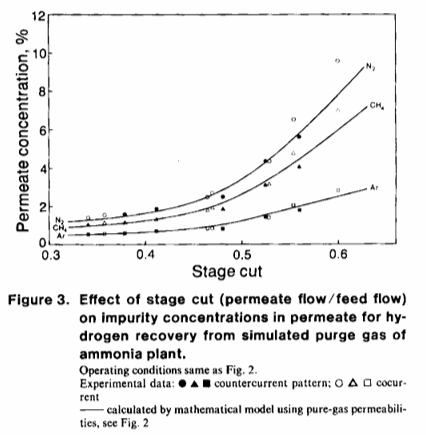
Hydrogen recovery from purge gas of ammonia plant is important. Pan compared model and experimental data for CH4, N2 and Argon mole fractions in the permeate stream at various values of stage cut (see Fig. 3 of Ref. 1). Here, we reproduce Fig. 3 of Ref. 1 using a counter-current gas permeation module and the methodology described in detail in Ref. 2.References:[1] Pan, C.Y. (1986), Gas separation by high-flux, asymmetric hollow-fiber membrane. AIChE J., 32: 2020-2027. https://doi.org/10.1002/aic.690321212[2] H . Binous, U . Zahid and A . Bellagi, Modeling for Multi - component Gas Permeation with Orthogonal Collocation and Arc - Length Continuation, Chemistry Africa (2024) . https://doi.org/10.1007/s42250-024-01167-y
In[]:=
Out[]=
{xA[1]0.500575,xB[1]0.255751,xC[1]0.202724,xA[2]0.500682,xB[2]0.255696,xC[2]0.20268,xA[3]0.501001,xB[3]0.255532,xC[3]0.20255,xA[4]0.501523,xB[4]0.255263,xC[4]0.202337,xA[5]0.502236,xB[5]0.254897,xC[5]0.202046,xA[6]0.503121,xB[6]0.254442,xC[6]0.201685,xA[7]0.504156,xB[7]0.25391,xC[7]0.201263,xA[8]0.505315,xB[8]0.253315,xC[8]0.20079,xA[9]0.506569,xB[9]0.252671,xC[9]0.200279,xA[10]0.507887,xB[10]0.251993,xC[10]0.199742,xA[11]0.509235,xB[11]0.2513,xC[11]0.199192,xA[12]0.510582,xB[12]0.250609,xC[12]0.198643,xA[13]0.511893,xB[13]0.249935,xC[13]0.198108,xA[14]0.513136,xB[14]0.249296,xC[14]0.197601,xA[15]0.514282,xB[15]0.248708,xC[15]0.197134,xA[16]0.515302,xB[16]0.248183,xC[16]0.196718,xA[17]0.516172,xB[17]0.247736,xC[17]0.196364,xA[18]0.516871,xB[18]0.247377,xC[18]0.196079,xA[19]0.517383,xB[19]0.247114,xC[19]0.19587,xA[20]0.517695,xB[20]0.246954,xC[20]0.195743,yA[2]0.983438,yB[2]0.00760996,yC[2]0.00580118,yA[3]0.983451,yB[3]0.0076041,yC[3]0.00579671,yA[4]0.983471,yB[4]0.00759451,yC[4]0.0057894,yA[5]0.9835,yB[5]0.00758145,yC[5]0.00577943,yA[6]0.983535,yB[6]0.00756525,yC[6]0.00576708,yA[7]0.983576,yB[7]0.00754636,yC[7]0.00575267,yA[8]0.983622,yB[8]0.00752526,yC[8]0.00573658,yA[9]0.983671,yB[9]0.0075025,yC[9]0.00571922,yA[10]0.983723,yB[10]0.00747865,yC[10]0.00570103,yA[11]0.983775,yB[11]0.00745432,yC[11]0.00568247,yA[12]0.983828,yB[12]0.0074301,yC[12]0.00566401,yA[13]0.983879,yB[13]0.0074066,yC[13]0.00564608,yA[14]0.983927,yB[14]0.00738437,yC[14]0.00562913,yA[15]0.983971,yB[15]0.00736395,yC[15]0.00561355,yA[16]0.984011,yB[16]0.00734581,yC[16]0.00559972,yA[17]0.984044,yB[17]0.00733037,yC[17]0.00558794,yA[18]0.984071,yB[18]0.00731798,yC[18]0.00557849,yA[19]0.984091,yB[19]0.00730893,yC[19]0.00557159,yA[20]0.984103,yB[20]0.00730341,yC[20]0.00556738,yA[21]0.984107,yB[21]0.00730156,yC[21]0.00556597,q[2]0.96459,q[3]0.965228,q[4]0.966274,q[5]0.967705,q[6]0.969487,q[7]0.97158,q[8]0.973933,q[9]0.976492,q[10]0.979195,q[11]0.981976,q[12]0.984768,q[13]0.987501,q[14]0.990107,q[15]0.99252,q[16]0.994678,q[17]0.996525,q[18]0.998015,q[19]0.999108,q[20]0.999776,theta0.035624,0.983434,0.00761193,0.00580268,0.0031517}
y
PAi
y
PBi
y
PCi
y
PDi
In[]:=
xA[Np+1]=.;xB[Np+1]=.;xC[Np+1]=.;q[Np+1]=.;q[1]=.;yA[1]=.;yB[1]=.;yC[1]=.;xA[Np+1][s_]:=;xB[Np+1][s_]:=;yA[1][s_]:=[s];yB[1][s_]:=[s];xC[Np+1][s_]:=;yC[1][s_]:=[s];q[Np+1][s_]:=;q[1][s_]:=(1-theta[s]);init=Join[Flatten[Table[{xA[i][0](xA[i]/.sol),yA[i][0](yA[i]/.sol),xC[i][0](xC[i]/.sol),yC[i][0](yC[i]/.sol),xB[i][0](xB[i]/.sol),yB[i][0](yB[i]/.sol)},{i,2,Np}],1],Flatten[Table[q[i][0](q[i]/.sol),{i,2,Np}],1],{theta[0](theta/.sol),[0](/.sol),st[0]0.001,yA[1][0](/.sol),yB[1][0](/.sol),yC[1][0](/.sol),yA[Np+1][0](yA[Np+1]/.sol),yB[Np+1][0](yB[Np+1]/.sol),yC[Np+1][0](yC[Np+1]/.sol),xA[1][0](xA[1]/.sol),xC[1][0](xC[1]/.sol),xB[1][0](xB[1]/.sol)}];initdev=Join[Flatten[Table[{xA[i]'[0]-0.1,yA[i]'[0]-0.1,xB[i]'[0]0.1,yB[i]'[0]0.1,xC[i]'[0]-0.1,yC[i]'[0]-0.1},{i,2,Np}],1],Flatten[Table[{q[i]'[0]-0.1},{i,2,Np}],1],{theta'[0]0.1,st'[0]0.1,xA[1]'[0]-0.1,xC[1]'[0]-0.1,xB[1]'[0]0.1,'[0]0.1,'[0]0.1,'[0]0.1,'[0]0.1,yA[Np+1]'[0]-0.1,yB[Np+1]'[0]-0.1,yC[Np+1]'[0]-0.1}];aux=Sum[xA[i]'[s]^2+yA[i]'[s]^2+xB[i]'[s]^2+yB[i]'[s]^2+xC[i]'[s]^2+yC[i]'[s]^2,{i,1,Np}]+Sum[q[i]'[s]^2,{i,2,Np}]+theta'[s]^2+st'[s]^2+'[s]^2+'[s]^2+'[s]^2+'[s]^2+yA[21]'[s]^2+yB[21]'[s]^2+yC[21]'[s]^21;unknown1=Join[Flatten[Table[{xA[i],yA[i],xB[i],yB[i],xC[i],yC[i]},{i,2,Np}],1],Flatten[Table[q[i],{i,2,Np}],1],{,,,,theta,st,yA[Np+1],yB[Np+1],yC[Np+1],xA[1],xB[1],xC[1]}];
x
fA
x
fB
y
PAi
y
PBi
x
fC
y
PCi
q
f
q
f
y
PDi
y
PDi
y
PAi
y
PBi
y
PCi
y
PAi
y
PBi
y
PCi
y
PDi
y
PAi
y
PBi
y
PDi
y
PCi
y
PAi
y
PBi
y
PCi
y
PDi
In[]:=
In[]:=
SYS=Join[sys/.functions,{aux},init,initdev];SOL=Quiet@NDSolve[SYS,unknown1,{s,-1000,1000},AccuracyGoal7];
Mole fraction of CH4, N2 and Argon in the permeate stream versus stage cut
In[]:=
pB=ParametricPlot[Evaluate[{theta[s],yB[Np+1][s]}/.SOL[[1]]],{s,-8.9,65},PlotRange{{0.3,0.65},{0,0.12}},FrameTrue,GridLinesAutomatic,AspectRatio1,PlotStyle{Thickness[0.0125],Darker@Blue,Dashed},FrameTrue,FrameLabel{Style["stage cut",16],Style["mole fraction in permeate stream",16]}];
In[]:=
pC=ParametricPlot[Evaluate[{theta[s],yC[Np+1][s]}/.SOL[[1]]],{s,-8.9,65},PlotRange{{0.3,0.65},{0,0.12}},FrameTrue,GridLinesAutomatic,AspectRatio1,PlotStyle{Thickness[0.0125],Darker@Red,Dashed},FrameTrue,FrameLabel{Style["stage cut",16],Style["mole fraction in permeate stream",16]}];
In[]:=
pD=ParametricPlot[Evaluate[{theta[s],1-yA[Np+1][s]-yB[Np+1][s]-yC[Np+1][s]}/.SOL[[1]]],{s,-8.9,65},PlotRange{{0.3,0.65},{0,0.12}},FrameTrue,GridLinesAutomatic,AspectRatio1,PlotStyle{Thickness[0.0125],Darker@Green,Dashed},FrameTrue,FrameLabel{Style["stage cut",16],Style["mole fraction in permeate stream",16]},PlotLegends->LineLegend[{Darker@Blue,Darker@Red,Darker@Green},{"N2","CH4","Ar"}]];
In[]:=
A=Show[pB,pC,pD,PlotRange{{0.3,0.6},{0,0.10}}]
Out[]=
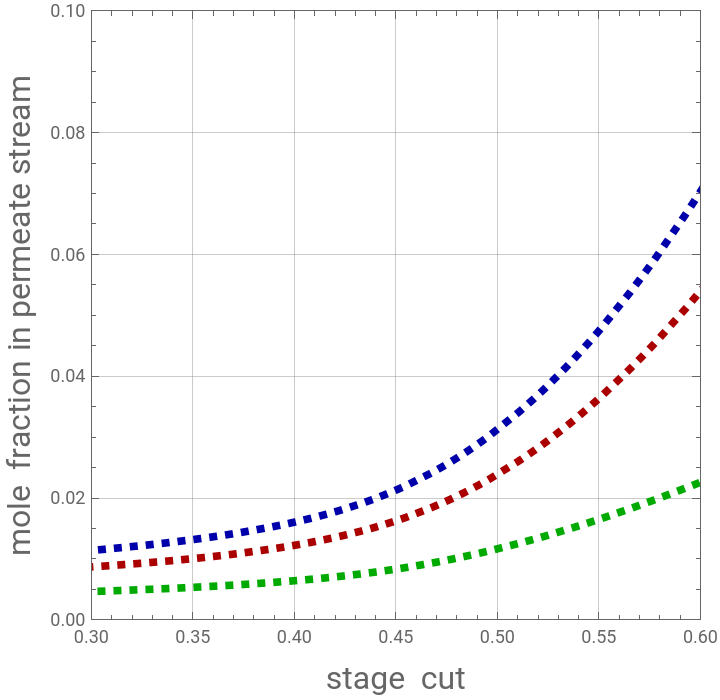


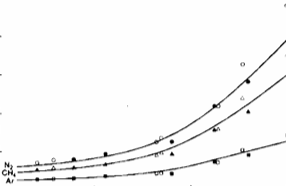
Comparison between our results and Fig. 3 of Ref. 1 indicates close agreement
In[]:=
img=
;
In[]:=
Show[A,ImageSize400{1,1},Prolog{Raster[ImageData[img,DataReversedTrue],{Scaled[{0.00,0.00}],Scaled[{1,1}]}]}]
Out[]=