In[]:=
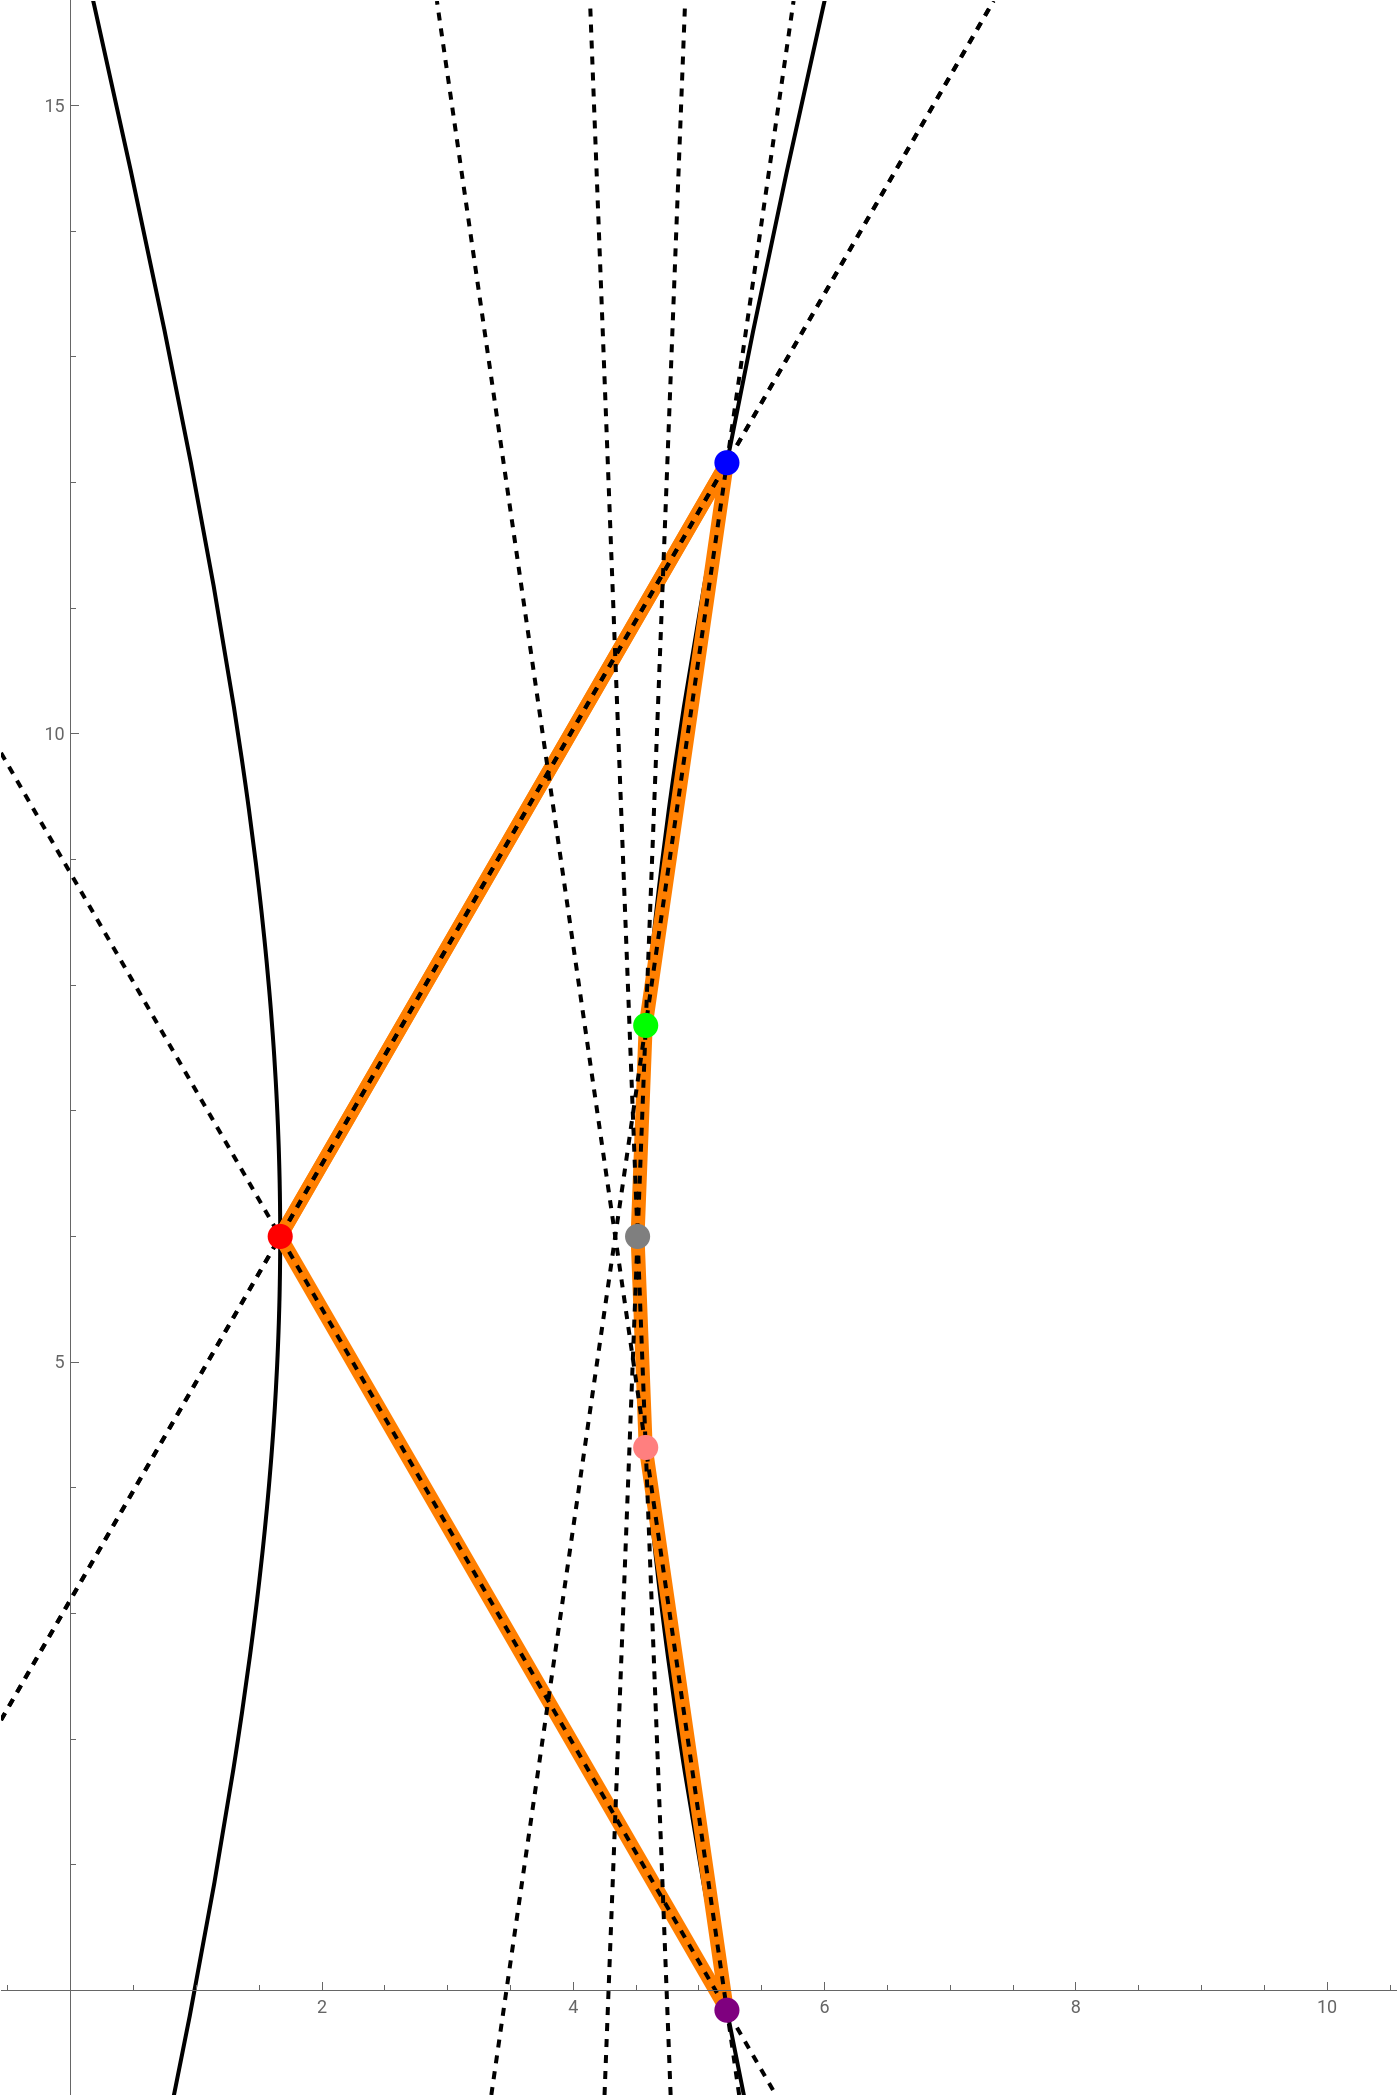
PascalTheorem::usage=" In any hexagon inscribed in a conical section, the continuations of opposite sides meet on a straight line, called the Pascal line. This property is repeated in Geometry, there is also the Monge's theorem and the Desargues' theorem. References: Personal, based in the Pascal's theorem. ";
Development:
Obtaining the vertices of the hexagon in numerical form:
In[]:=
r=2;k=4;d=-3;n=6;ρ=;x1=4;y1=6;Table{4-d,y1}++-{(r+ρ)Cos[t1]+x1-(4-d),(r+ρ)Sin[t1]+y1-6},t1,0,2π,
2Sin
π
n
1-Sin
π
n
2
k
2
((r+ρ)Cos[t1]+x1-(4-d))
2
((r+ρ)Sin[t1]+y1-6)
2
ρ
2π
n
,6,,6+,,6+,,6,,6-,,6-,,6;
5
3
47
9
32
3
3
151
33
32
11
3
203
45
151
33
32
11
3
47
9
32
3
3
5
3
In[]:=
Showr=2;k=4;d=-3;n=6;ρ=;x1=4;y1=6;ParametricPlotCosh[t]+,Sinh[t]+6,{t,-π,π},PlotStyle->{Black,Thick},ParametricPlot-Cosh[t]+,Sinh[t]+6,{t,-π,π},PlotStyle->{Black,Thick},TableGraphicsOrange,Thickness[0.01],Line{4-d,y1}++-{(r+ρ)Cos[t1]+x1-(4-d),(r+ρ)Sin[t1]+y1-6},{4-d,y1}++-(r+ρ)Cost1++x1-(4-d),(r+ρ)Sint1++y1-6,t1,0,2π,,TableGraphicsBlack,Thick,Dashed,InfiniteLine{4-d,y1}++-{(r+ρ)Cos[t1]+x1-(4-d),(r+ρ)Sin[t1]+y1-6},{4-d,y1}++-(r+ρ)Cost1++x1-(4-d),(r+ρ)Sint1++y1-6,t1,0,2π,,GraphicsRed,PointSize[0.018],Point,6,GraphicsBlue,PointSize[0.018],Point,6+,GraphicsGreen,PointSize[0.018],Point,6+,GraphicsGray,PointSize[0.018],Point,6,GraphicsPink,PointSize[0.018],Point,6-,GraphicsPurple,PointSize[0.018],Point,6-,AxesTrue,BoxRatiosAutomatic,AxesOrigin{0,0},ImageSize700,PlotRange{{0,10},{0,15}}
2Sin
π
n
1-Sin
π
n
128
90
139
45
64
3
15
128
90
139
45
64
3
15
2
k
2
((r+ρ)Cos[t1]+x1-(4-d))
2
((r+ρ)Sin[t1]+y1-6)
2
ρ
2
k
2
(r+ρ)Cost1++x1-(4-d)
2π
n
2
(r+ρ)Sint1++y1-6
2π
n
2
ρ
2π
n
2π
n
2π
n
2
k
2
((r+ρ)Cos[t1]+x1-(4-d))
2
((r+ρ)Sin[t1]+y1-6)
2
ρ
2
k
2
(r+ρ)Cost1++x1-(4-d)
2π
n
2
(r+ρ)Sint1++y1-6
2π
n
2
ρ
2π
n
2π
n
2π
n
5
3
47
9
32
3
3
151
33
32
11
3
203
45
151
33
32
11
3
47
9
32
3
3
Out[]=
In[]:=
Showr=2;k=4;d=-3;n=6;ρ=;x1=4;y1=6;TableGraphicsBlack,Thick,Line{4-d,y1}++-{(r+ρ)Cos[t1]+x1-(4-d),(r+ρ)Sin[t1]+y1-6},{4-d,y1}++-(r+ρ)Cost1++x1-(4-d),(r+ρ)Sint1++y1-6,t1,0,2π,,TableGraphicsBlack,Thick,Dashed,InfiniteLine{4-d,y1}++-{(r+ρ)Cos[t1]+x1-(4-d),(r+ρ)Sin[t1]+y1-6},{4-d,y1}++-(r+ρ)Cost1++x1-(4-d),(r+ρ)Sint1++y1-6,t1,0,2π,,GraphicsRed,PointSize[0.018],Point,6,GraphicsBlue,PointSize[0.018],Point,6+,GraphicsGreen,PointSize[0.018],Point,6+,GraphicsGray,PointSize[0.018],Point,6,GraphicsPink,PointSize[0.018],Point,6-,GraphicsPurple,PointSize[0.018],Point,6-,AxesTrue,BoxRatiosAutomatic,AxesOrigin{0,0},ImageSize700,PlotRange{{0,10},{-1,15}}
2Sin
π
n
1-Sin
π
n
2
k
2
((r+ρ)Cos[t1]+x1-(4-d))
2
((r+ρ)Sin[t1]+y1-6)
2
ρ
2
k
2
(r+ρ)Cost1++x1-(4-d)
2π
n
2
(r+ρ)Sint1++y1-6
2π
n
2
ρ
2π
n
2π
n
2π
n
2
k
2
((r+ρ)Cos[t1]+x1-(4-d))
2
((r+ρ)Sin[t1]+y1-6)
2
ρ
2
k
2
(r+ρ)Cost1++x1-(4-d)
2π
n
2
(r+ρ)Sint1++y1-6
2π
n
2
ρ
2π
n
2π
n
2π
n
5
3
47
9
32
3
3
151
33
32
11
3
203
45
151
33
32
11
3
47
9
32
3
3
Obtaining the equations of the opposite sides:
PurplePink line and BlueGreen, form the middle point between Red and Gray points:
Complete graph:
The graph shows Pascal’s line.