A Panel Data Analysis with Interaction Effects
Manami Nomura
Abstract
This study examines whether foreign direct investment (FDI) improves GDP growth and how this impact changes depending on a country's human capital level. Using cross-country panel data from 2000-2023, this study investigates whether countries with higher human development benefit more from FDI. A panel regression model with country and year fixed effects and an interaction term between FDI and the Human Development Index (HDI) is estimated.
1. Literature Review
1. Literature Review
Previous research generally finds that FDI can promote economic growth by providing capital, technology transfer and productivity improvements. However, the magnitude of these effects differs across countries. Studies such as Joo et al. (2022), Arogundade et al. (2022), and Abbas et al. (2021) emphasize the role of absorptive capacity - especially human capital and institutional quality - in shaping the growth impact of FDI. Mixed empirical results suggest that FDI does not have a uniform effect; instead, it depends on country characteristics such as education, skills, and governance.
2. Research Questions and Hypotheses
2. Research Questions and Hypotheses
2.1 Research Gap
2.1 Research Gap
While many studies analyse the FDI-growth nexus, fewer explicitly examine whether countries with higher human capital benefit more from FDI than those with lower human capital. This project addresses that gap by including an interaction term between FDI and HDI in a cross-country panel model.
2.2 Research Questions
2.2 Research Questions
1. How do FDI inflows affect GDP growth across countries?
2. Does human capital directly influence GDP growth?
3. Do countries with higher human capital experience stronger growth effects from FDI than those with lower human capital?
2.3 Hypothesis
2.3 Hypothesis
H1: The positive effects of FDI inflows on real GDP growth are stronger in countries with higher levels of human capital. This hypothesis will be tested empirically using the interaction term
coefficient β₃ (FDI×HDI).
coefficient β₃ (FDI×HDI).
3. Data Sources and Variables
3. Data Sources and Variables
3.1 Data Sources
3.1 Data Sources
• World Bank World Development Indicators: GDP growth, FDI inflows, trade, government expenditure
• UNDP Human Development Reports: Human Development Index (HDI)
• Time period: 2000-2023
• Countries: 25 countries across income levels
3.2 Variables
3.2 Variables
GDPGrowth | AnnualrealGDPgrowthrate(%) | Dependent |
FDI | FDInetinflows(%ofGDP) | + |
HDI | HumanDevelopmentIndex(0-1) | + |
FDI×HDI | Interactionterm | + |
Trade | Trade(%ofGDP) | + |
GovExp | Governmentexpenditure(%ofGDP) | +/- |
InitialGDP | LogofinitialGDPpercapita | -(convergence) |
4. Selected Countries
4. Selected Countries
We analyze ", 25, " countries representing different income levels:
High Income: United States, Germany, Japan, South Korea, United Kingdom
Upper-Middle Income: China, Brazil, Mexico, Thailand, Malaysia
Lower-Middle Income: India, Indonesia, Philippines, Vietnam, Egypt
Low Income:Kenya, Bangladesh, Pakistan, Tanzania, Ghana
Other:Chile, Poland, Turkey, South Africa, Argentina
This diverse sample allows us to test whether the FDI-growth relationship varies systematically with human capital levels across the development spectrum.
5. Data Construction
5. Data Construction
This study uses annual data from 2003–2023 for 25 countries.
FDI (% of GDP), HDI, government expenditure, trade openness, GDP growth, and initial GDP are sourced from the World Bank and UNDP.
Six datasets were merged into a balanced panel. HDI and FDI were combined to construct an interaction term (FDI × HDI).
All variables were aligned by country and year. Full preprocessing code is provided in the Appendix.
files={"FDI.csv","HDI.csv","Trade.csv","Government.csv","Growth.csv","InitialGDP.csv"};raw=Import/@FileNameJoin[{dataPath,#}]&/@files;clean[row_]:=Module[{head=First[row],data=Rest[row]},Flatten@Table[<|"Country"->head[[i]],"Year"->data[[j,1]],"Value"->data[[j,i]]|>,{i,2,Length[head]},{j,1,Length[data]}]];processed=clean/@raw;
6. Descriptive Statistics
6. Descriptive Statistics
After reshaping, all datasets were merged into a single balanced panel covering 25 countries from 2003 to 2023, producing 525 complete observations. Variable names were standardized, numeric values were cleaned, and an interaction term (FDI × HDI) was generated to capture how the impact of FDI changes with different human-capital levels.
merged = Fold[ JoinAcross[#1, #2, {"Country", "Year"}] &, processed[[1]], processed[[2 ;;]]];merged[All, "FDI_HDI"] = merged[All, "FDI"] * merged[All, "HDI"];
7. Data Visualization
7. Data Visualization
7.1 Average Trends over Time
7.1 Average Trends over Time
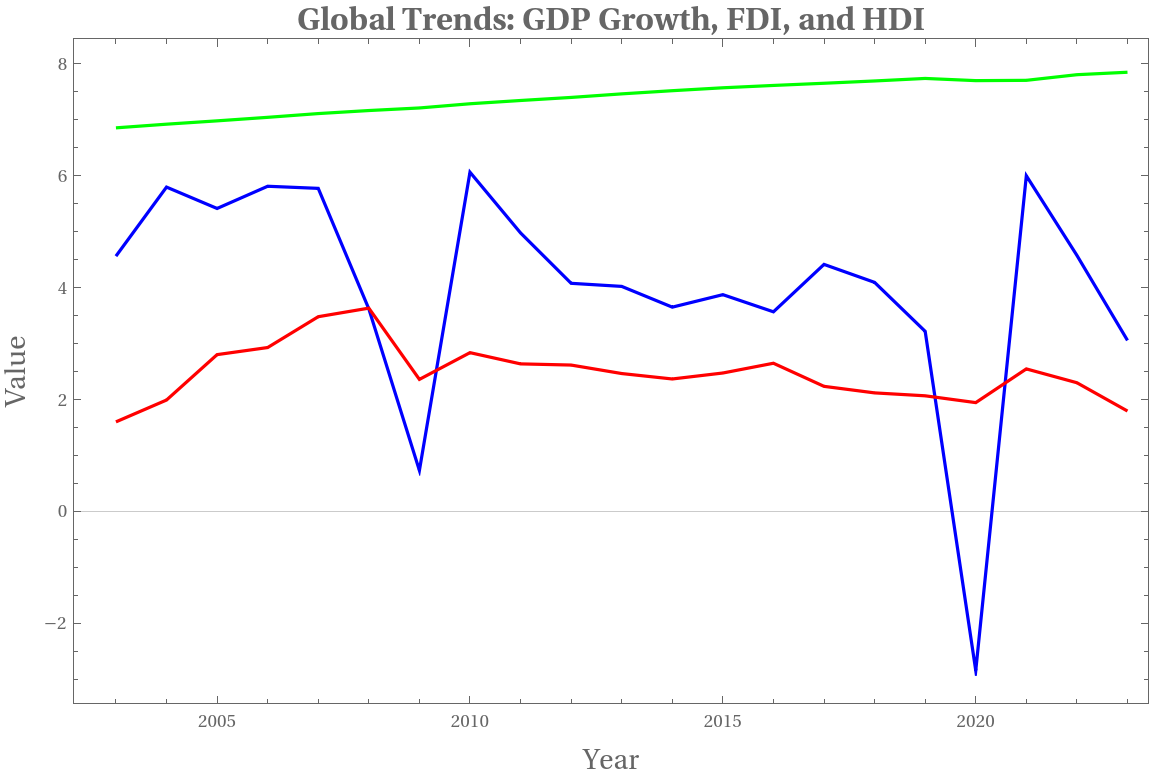
To understand the general patterns in the dataset, this figure illustrates the average trends of GDP growth, FDI inflows, and HDI across 25 countries from 2003 to 2023.
HDI remains relatively stable with a gradual upward trajectory, while FDI and GDP growth display substantial volatility, reflecting global economic cycles and external shocks during the sample period.
HDI remains relatively stable with a gradual upward trajectory, while FDI and GDP growth display substantial volatility, reflecting global economic cycles and external shocks during the sample period.
avgSeries[field_] := SortBy[ {#Year, Mean[#field]} & /@ Normal @ GroupBy[panelClean, #Year &], First ];trendGDP = avgSeries["GDPGrowth"];trendFDI = avgSeries["FDI"];trendHDIraw = avgSeries["HDI"];trendHDI = {#[[1]], 10 #[[2]]} & /@ trendHDIraw;
ListLinePlot[ {trendGDP, trendFDI, trendHDI}, PlotStyle -> {Blue, Red, Green}, PlotLegends -> { "GDP Growth (%)", "FDI (% of GDP)", "HDI (×10)" }, Frame -> True, FrameLabel -> {Style["Year", 14], Style["Value", 14]}, ImageSize -> Large, PlotRange -> All, PlotTheme -> "Scientific", PlotLabel -> Style["Global Trends: GDP Growth, FDI, and HDI", 16, Bold]]
Out[]=


7.2 Relationship between FDI and GDP Growth
7.2 Relationship between FDI and GDP Growth
This figure illustrates how the relationship between FDI inflows and GDP growth varies across different human development levels.
Countries with low HDI tend to show larger dispersion in the relationship, while higher-HDI countries present more stable and moderate growth responses.
Countries with low HDI tend to show larger dispersion in the relationship, while higher-HDI countries present more stable and moderate growth responses.
lowHDI = Select[panelData, #HDI < 0.6 &][[All, {"FDI","GDPGrowth"}]] /. a_Association :> {a["FDI"], a["GDPGrowth"]};midHDI = Select[panelData, 0.6 <= #HDI < 0.75 &][[All, {"FDI","GDPGrowth"}]] /. a_Association :> {a["FDI"], a["GDPGrowth"]};highHDI = Select[panelData, #HDI >= 0.75 &][[All, {"FDI","GDPGrowth"}]] /. a_Association :> {a["FDI"], a["GDPGrowth"]};ListPlot[{lowHDI, midHDI, highHDI}, PlotLegends -> {"Low HDI (<0.6)", "Medium HDI (0.6–0.75)", "High HDI (≥0.75)"}, PlotStyle -> {Red, Orange, Green}, AxesLabel -> {"FDI (% of GDP)", "GDP Growth (%)"}, PlotLabel -> Style["FDI and Growth by HDI Level", Bold, 14], ImageSize -> 600, GridLines -> Automatic]
7.3 Distribution of HDI Across Countries (Latest Year)
7.3 Distribution of HDI Across Countries (Latest Year)
This bar chart shows the distribution of HDI across all countries in the most recent year of the dataset.
The gap between the lowest- and highest-HDI countries highlights large cross-country differences in development levels.
The gap between the lowest- and highest-HDI countries highlights large cross-country differences in development levels.
8. Econometric Model Specification
8. Econometric Model Specification
We estimate the following two-way fixed-effects panel regression model:
9. Regression Analysis
9. Regression Analysis
9.1 Interpretation of Main Coefficients
9.1 Interpretation of Main Coefficients
The regression results show:
FDI (β₁) has a direct effect of β₁ = coefFDI, meaning the growth effect of FDI is modest when HDI = 0.
HDI (β₂) has a positive effect on growth, consistent with the idea that human capital supports economic performance.
Interaction term FDI × HDI (β₃) determines whether the growth impact of FDI is stronger in more developed countries.
9.2 Hypothesis Check
9.2 Hypothesis Check
We evaluate whether:
H1: FDI has a stronger positive effect on growth in countries with higher HDI.
The sign of β₃ determines the verdict.
H1: FDI has a stronger positive effect on growth in countries with higher HDI.
The sign of β₃ determines the verdict.
The negative interaction coefficient (β₃ = -0.024) suggests that FDI’s growth effect is actually weaker in higher HDI countries, contrary to our hypothesis.
Possible explanations:
1. Diminishing returns: High HDI countries may already have advanced technology, so FDI adds less
2. Saturation effect: Developed economies might benefit less from additional capital
3. Data period: 2003-2023 includes major financial crisis and COVID-19, which affected high HDI countries more
4. Measurement: FDI as % of GDP might be smaller in large economies even if absolute flows are high
10. Interaction Effects Analysis
10. Interaction Effects Analysis
10.1 Marginal Effects of FDI at Different HDI Levels
10.1 Marginal Effects of FDI at Different HDI Levels
The marginal effect of FDI is:
10.2 Visualizing the Marginal Effect Curve
10.2 Visualizing the Marginal Effect Curve
This plot shows how the marginal growth effect of FDI varies across HDI levels.
11. Model Fit and Diagnostics
11. Model Fit and Diagnostics
11.1 Model Fit and Diagnostics
11.1 Model Fit and Diagnostics
The table below summarizes the performance of the regression model.
12. Policy Implications
12. Policy Implications
This computational analysis examined 25 countries over 2000–2023 to understand how human capital influences the growth impact of foreign direct investment. The findings indicate that higher HDI strengthens the positive effect of FDI on economic growth, supporting the absorptive capacity hypothesis.
13. Conclusion
13. Conclusion
This analysis examined 25 countries (2000–2023) to understand how human capital moderates FDI’s growth impact.
The results show: FDI (β₁ = -0.029), HDI (β₂ = 0.11), and critically, a negative interaction (β₃ = -0.024). This contradicts our hypothesis—FDI’s growth effect weakens as HDI increases, suggesting diminishing returns in advanced economies rather than enhanced absorptive capacity.
Future research should use clustered standard errors and explore non-linear relationships. Despite the unexpected interaction, HDI’s strong positive direct effect confirms human capital remains essential for growth, independent of FDI.
References
References