We tend to think of the seven continents today as fixed puzzle pieces that have moved around since ancient geological history. Although this is partially true, it leaves out a few important concepts. The first is that the continents, as they appear today, were themselves assembled from earlier fragments. The stable pieces of the modern continents, called cratons, were sutured together, weathered down, and moved around into their current configuration. Second, there is also the destruction of continents that get subducted under other plates and get recycled in the Earth’s mantle. But there is a third concept that it often overlooked in this story. The fact that continents don’t just come together, and separate along expected boundaries repeatedly, but can be split apart along new boundaries to become new continents. The boundaries themselves are dynamic over geologic timescales.
Plate Configuration One Billion Years Ago
Plate Configuration One Billion Years Ago
One billion years ago, the Earth looked very different. Almost anyone with a minor interest in geology has heard of the supercontinent of Pangea, but many don’t know that this was not the first supercontinent. Pangea existed about 300 million years ago, but one billion years ago a different supercontinent formed, Rodinia.
stenianplates=["ContinentalPlates"];
In[]:=
GeoGraphics[{GeoStyling[Opacity[1],Lighter[Gray,.4]],stenianplates},GeoBackgroundLightBlue,GeoProjection"Mollweide",GeoGridLinesAutomatic]
Out[]=
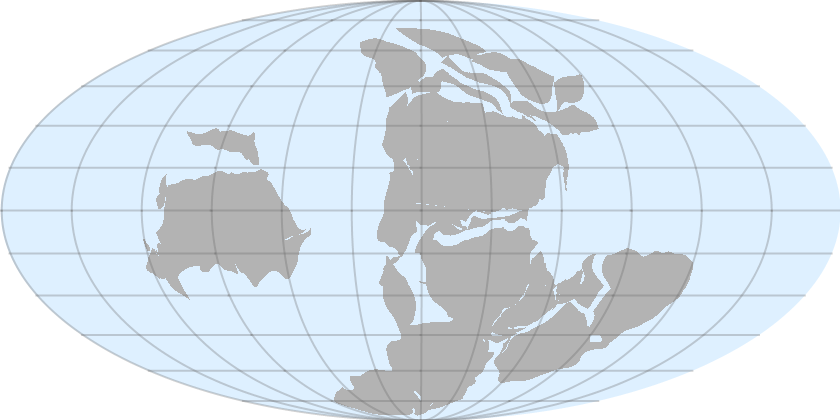
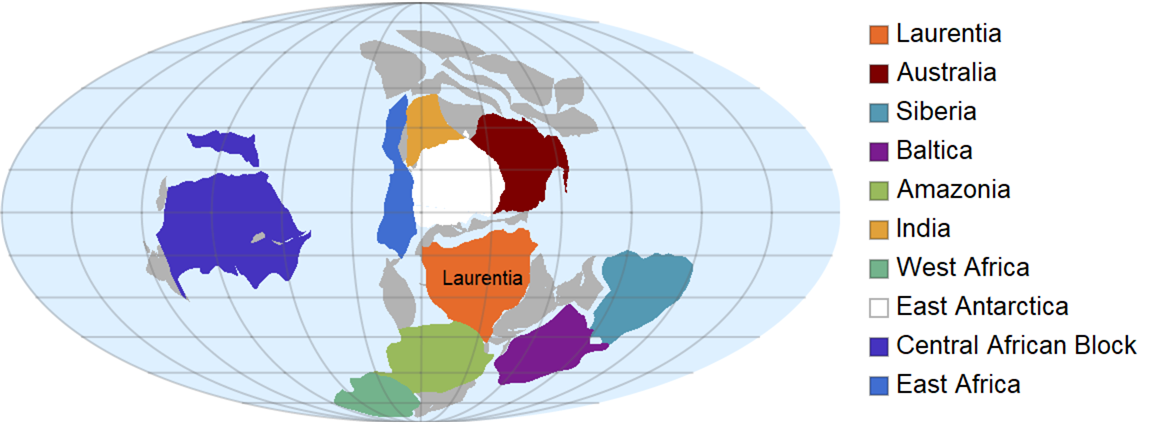
Much of modern day North America was part of a continent called Laurentia and was located on or just south of the equator and was drifting northwards. This far back in time, there is debate as to the exact positions of the continents so there may be disagreements depending on the source used (C. R. Scotese used here). Here I color code a few of the modern familiar continents (or parts of them) to illustrate
plateStyle[plate_List,color_?ColorQ]:={GeoStyling[Opacity[1],color],Sequence@@Flatten[plate]};laurentia=plateStyle{stenianplates[[18]]},;australia=plateStyle{stenianplates[[58]]},;siberia=plateStyle{stenianplates[[12]]},;baltica=plateStyle{stenianplates[[16]]},;amazonia=plateStyle{stenianplates[[67;;68]]},;india=plateStyle{stenianplates[[37;;38]]},;westafrica=plateStyle{stenianplates[[77]]},;eastantarctica=plateStyle{stenianplates[[62;;66]]},;centralafricanblock=plateStyle{stenianplates[[78;;79]],stenianplates[[76]],stenianplates[[69]],stenianplates[[82]],stenianplates[[72]]},;eastafrica=plateStyle{stenianplates[[80]]},;LegendedGeoGraphics[{GeoStyling[Opacity[1],Lighter[Gray,.4]],stenianplates,laurentia,australia,siberia,baltica,amazonia,india,westafrica,eastantarctica,centralafricanblock,eastafrica,Black,Text["Laurentia",GeoPosition[Mean[Cases[laurentia,{x_?NumberQ,y_?NumberQ},Infinity]]]]},GeoBackgroundLightBlue,GeoProjection"Mollweide",GeoGridLinesAutomatic],SwatchLegend,,,,,,,,,,{"Laurentia","Australia","Siberia","Baltica","Amazonia","India","West Africa","East Antarctica","Central African Block","East Africa"}


Out[]=
Ancient Rifts and Gravity Surveys
Ancient Rifts and Gravity Surveys
When continents break apart, a process called rifting occurs. During rifting, magma from the mantle pushes upwards under a continent causing the crust to get thinner along a y-shaped triple junction. Volcanism is found with such features. As the rift deepens and widens, a rift lake may form. In major rifts, an ocean fills the expanding rift valley and the rift lies along a mid-ocean ridge.
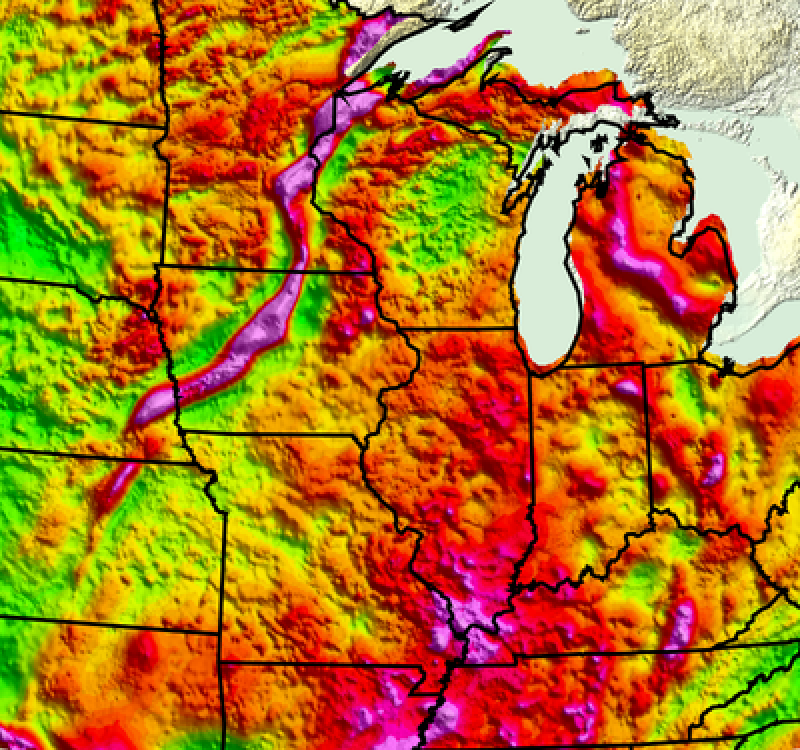
1.1 billion years ago, a mid-continent rift system started to form under Laurentia, centered approximately under and along Lake Superior. The rift failed and Laurentia maintained its integrity. Failed rifts are known as aulacogens. These scars of these ancient rifts are deeply buried and can usually only be seen in precision gravity surveys. Two arms of the mid-continent rift system, a triple junction, lie in the United States and the third arm extends into Ontario Canada. The southwest arm extends from Lake Superior down through Iowa and into Nebraska and Kansas, while the southeast arm extends from Lake Superior through Michigan. Using data from the United States Geological Survey (USGS) combined with GeoGraphics, this rift system can be explored.
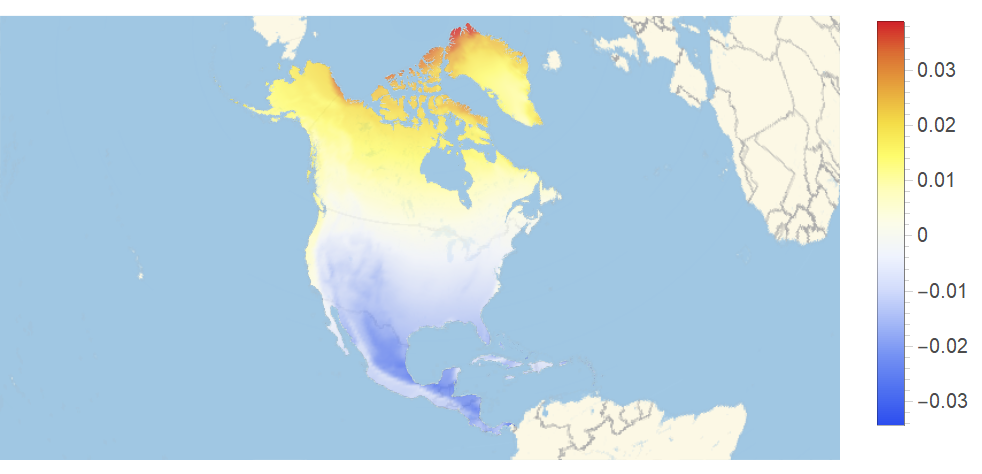
One tool used to study subsurface geology is called a gravity anomaly. This shows how the local gravity deviates from the global average value. Models exist that compute how the gravity changes on a coarse scale across the globe. For example, due to the ellipticity of the Earth, areas near the equator and pole deviate more than those areas in between. Areas with mountains cause additional anomalies that cause the result to be less of a smooth gradient. For example, here is the gravity anomaly for North America. There is a general positive to negative trend in the gravity anomaly as you go from north to south, but the Rocky Mountains produce additional local deviations due to their added elevation.
data=NormalGeogravityModelData,"DownComponent",GeoZoomLevel1-Quantity[1,"StandardAccelerationOfGravity"];
In[]:=
plot=ListDensityPlot[QuantityMagnitude@data,FrameFalse,PlotRangePadding0,ColorFunction"TemperatureMap"];
In[]:=
LegendedGeoGraphicsGeoStyling[{"GeoImage",plot}],Opacity[0.8],Polygon,BarLegend[{"TemperatureMap",{Min[#],Max[#]}&@Flatten[QuantityMagnitude@data]}]
Out[]=
If corrections are made to remove latitude and height deviations, among others, then it is possible to detect gravity anomalies due to density variations in buried substructures in the underlying bedrock. The data being explored here shows the Bouguer anomaly, a type of gravity anomaly, over the area of interest. Denser rocks, such as those resulting from denser mantle magmas, have the highest associated anomalies and are shown in pink colors. The USGS has published data on the Bouguer anomaly.
In[]:=
SetDirectory[NotebookDirectory[]];
In[]:=
ustif=Import["USgrv_cba_SDD_geog.tif","GeoTIFF"];
In[]:=
lines=Line@@@EntityValueEntityClass["AdministrativeDivision","USStatesAllStates"],;
In[]:=
GeoGraphics{GeoStyling[{"GeoImage",ColorReplace[ImageCrop[ustif],WhiteRGBColor[1,1,1,0]]}],Polygon[Entity["Country","UnitedStates"]],Black,Thickness[.005],lines},GeoRangeQuantity[450,"Miles"],GeoCenter,GeoBackground"ReliefMap"
Out[]=
Interestingly, the data also shows the scars from another failed rift a bit further south, the Southern Oklahoma Aulacogen. This failed rift is much more recent and happened during the late Neoproterozoic Era to early Paleozoic Era, between 525 and 550 million years ago.
In[]:=
GeoGraphics{GeoStyling[{"GeoImage",ColorReplace[ImageCrop[ustif],WhiteRGBColor[1,1,1,0]]}],Polygon[Entity["Country","UnitedStates"]],Black,Thickness[.005],lines,White,Text[Rotate[Style["Southern Oklahoma Aulacogen",Bold,14],-30Degree],GeoPosition[{35,-99}]],Rotate[Text[Style["Ouachita Orogenic Belt",Bold,14],GeoPosition[{33.5,-96}]],70Degree]},GeoCenter,GeoRangeQuantity[425,"Miles"],GeoBackground"ReliefMap"
Out[]=
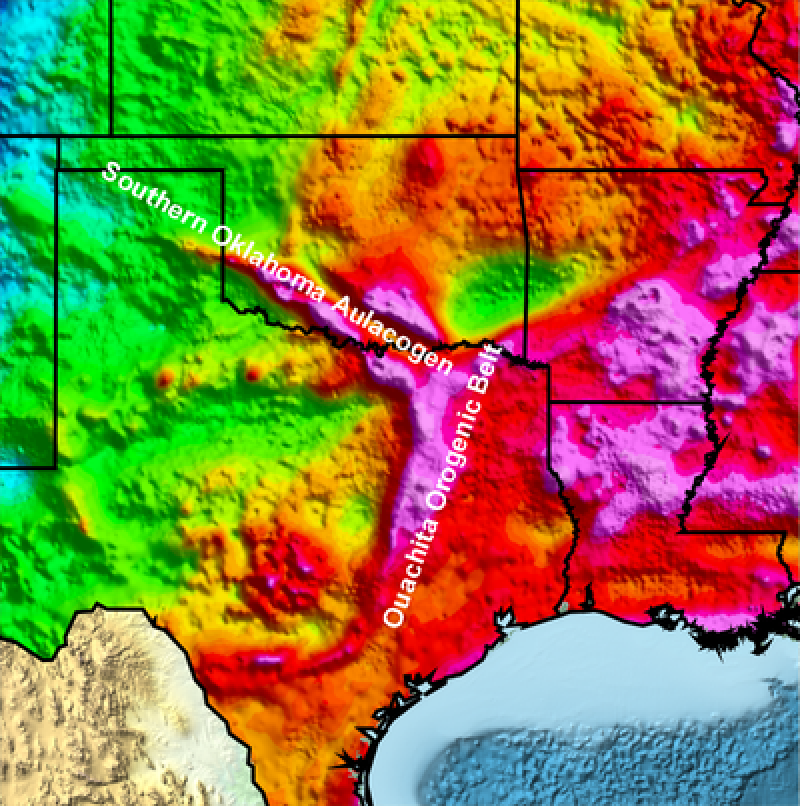
Though harder to see due to more recent uplift episodes along the modern southern margin during the formation of Pangea, the Reelfoot Rift was another failed arm of the triple junction that the Southern Oklahoma Aulacogen was part of. Seismic zones connected to this buried failed rift and the numerous faults within it, such as the New Madrid seismic zone, continue to generate earthquakes such as those shown in white below. In fact, between 1811 and 1812 the area around New Madrid, Missouri experienced the largest earthquakes in the contiguous United States, east of the Rocky Mountain in recorded history. The earthquakes are believed to have been between 7.2 and 8.6 in magnitude. At the time, the area was sparsely populated, but today such a series of earthquakes would be devastating since buildings in this area are not build with earthquake standards in mind as they are further west where earthquakes are more common.
In[]:=
newmadriddata=EarthquakeData[GeoDisk[{36.5856739`,-89.552713`},Quantity[150,"Miles"]],{0,10},{{1800,1,1},{2020,12,28}}];
In[]:=
GeoGraphics{GeoStyling[{"GeoImage",ImageCrop[ustif]}],Polygon[Entity["Country","UnitedStates"]],Black,Thickness[.005],lines,White,PointSize[.003],Point[#["Position"]&/@Values[newmadriddata]],Text[Rotate[Style["Reelfoot Rift",Bold,14],30Degree],GeoPosition[{34.75,-91.5}]]},GeoCenter,GeoRangeQuantity[425,"Miles"],GeoModel"Clarke1866"
Plate Configuration During the Cambrian Period
Plate Configuration During the Cambrian Period
The south and eastern arms of this triple junction were once spreading ridges active when Rhodinia broke apart due to rifting when Laurentia separated from Amazonia (part of modern day South America) during the Ediacaran Period. The following shows the configuration of Laurentia (once again in dark orange) as it drifted north after the separation from Amazonia, which was near the south pole, during the Cambrian Period. The sea that opened between Laurentia and Amazonia was known as the Iapetus Ocean.
As before, I can highlight some modern continents and/or parts to help with orientation.
Later, the Iapetus Ocean closed and the spreading ridges and intervening oceanic crust subducted under Laurentia forming the Ouachita Mountains as the next supercontinent, Pangea, formed.
Modern Rifts
Modern Rifts
Perhaps one of the best examples of a modern and active rift system is the East African Rift System. If you plot the location all of the mountains and volcanoes in this area, you can see that many of them fall along a line in Ethiopia. In addition, lines drawn along the Gulf of Aden and the Red Sea join up with this lines of mountains to form a y-shaped triple junction. This is where the African plate, Arabian plate, and Indian plate meet. The African plate is in the process of splitting into two plates, the Somali plate to the east and the Nubian plate to the west.
Using a relief map, its easier to see the visible scars left on the land and in the seas caused by this rifting.
Here’s the same mountains and volcanoes as seen above, but with the relief shown.
Many triple junctions appear along underwater rifts, for example, the Nootka Fault west of Vancouver Island in the Pacific Ocean is one arm of a triple junction. The location of the arms of this triple junction can be highlighted by examining the location of the earthquakes in the area as well as seeing the bathymetry data off the coast.
Earth’s geological history is full of dynamic events. These events are not just curiosities of the past, but continue to the current day. As time goes forward, modern tectonic plates will move around, be broken up due to rifting and may even be subducted and cease to exist, taking with them much of the geological history that affected them. But studying magnetic and gravity measurements can reveal the buried remnants of the ancient events. Studying active rifting areas can give us hints of the future configuration of the continents. The Wolfram Language provides tools that allow you to explore all of these concepts in a unified environment.
References
References