#100DaysOfCode
#100DaysOfCode
Day 63: View some data about the BRICS economic group
#100DaysOfCode #wolframlang #wolflang #DataScience #Code #Programming #GEO
#100DaysOfCode #wolframlang #wolflang #DataScience #Code #Programming #GEO
In[]:=
BRICS=CountryData["BRICS"]
Out[]=
,,,,
In[]:=
CountryData[#,"Population"]&/@BRICS
Out[]=
,,,,
In[]:=
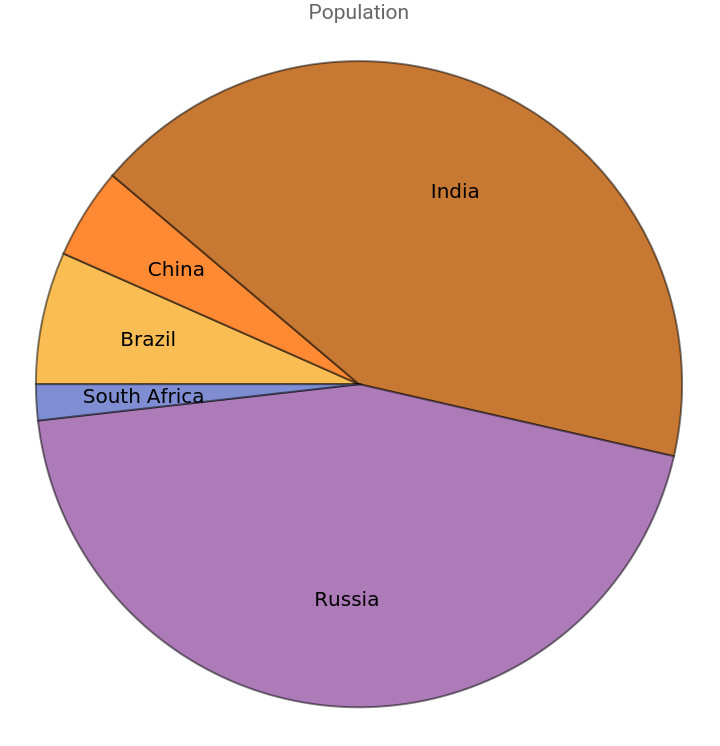
PieChart[%3,ChartLabelsBRICS,PlotLabel"Population"]
Out[]=
In[]:=
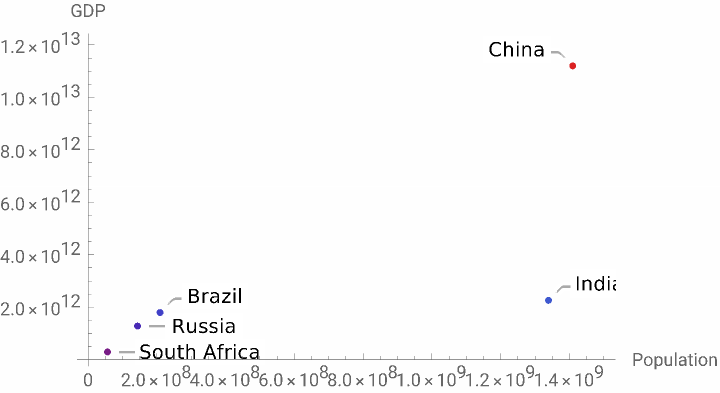
ListPlot[Callout[{CountryData[#,"Population"],CountryData[#,"GDP"]},CountryData[#,"Name"]]&/@BRICS,ColorFunction"Rainbow",AxesLabel{"Population","GDP"}]
Out[]=
In[]:=
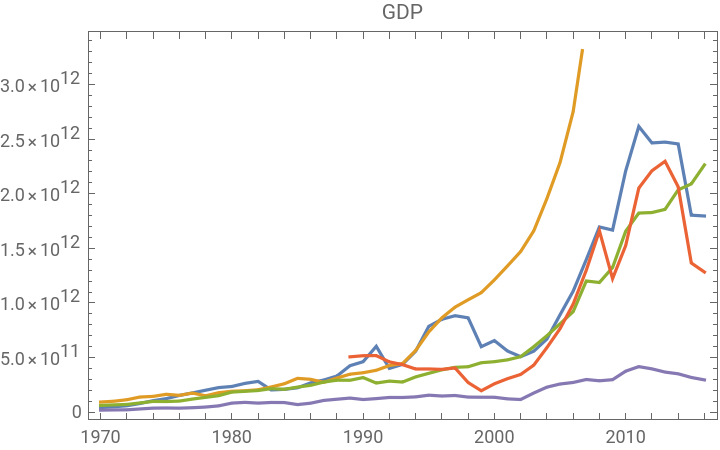
DateListPlot[CountryData[#,{{"GDP"},{1970,2019}}]&/@BRICS,PlotLegendsBRICS,PlotLabel"GDP"]
Out[]=


In[]:=
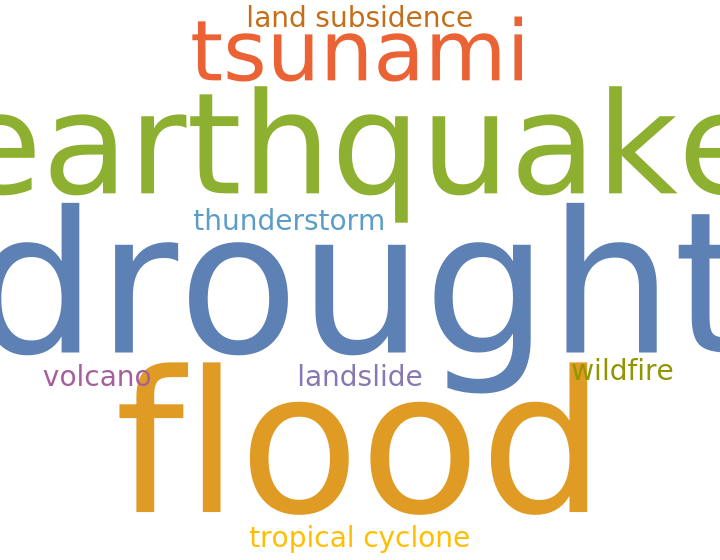
WordCloud[Flatten[CountryData[#,"NaturalHazards"]&/@BRICS]]
Out[]=