Vapor-Liquid Equilibrium Diagram for Non-Ideal Mixture
Vapor-Liquid Equilibrium Diagram for Non-Ideal Mixture


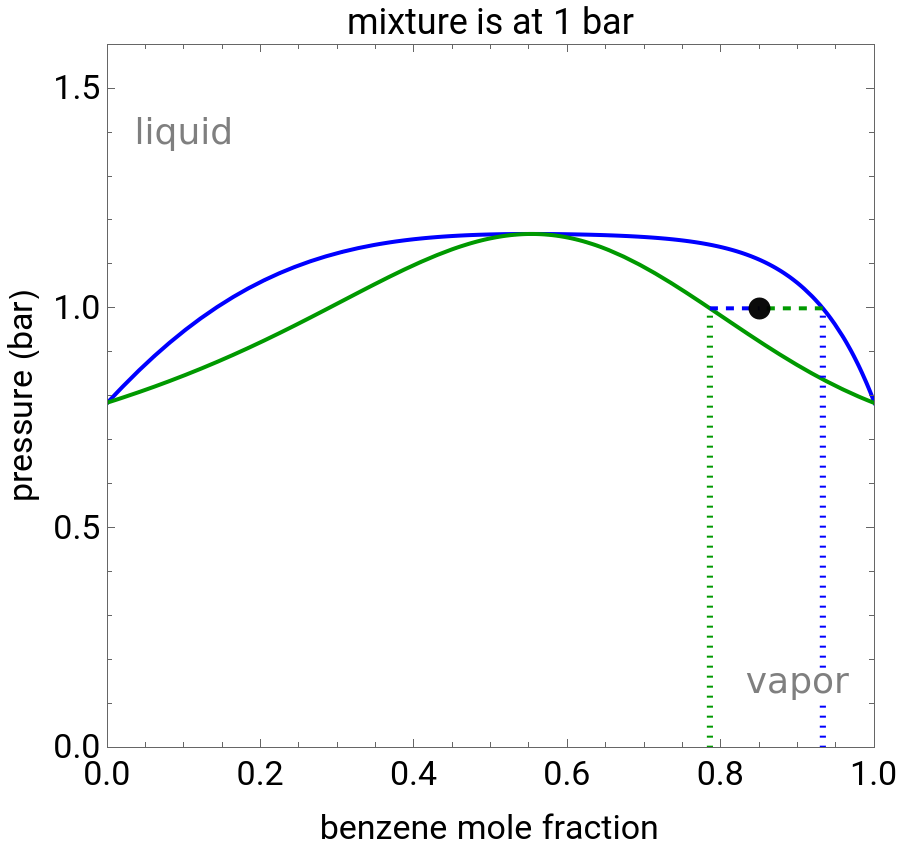

This Demonstration shows and diagrams for vapor-liquid equilibrium (VLE) of a benzene/ethanol mixture. This liquid mixture is non-ideal, and the system has an azeotrope (a condition where liquid and vapor have the same composition). The blue curve represents the liquid-phase boundary (bubble point), and the green curve represents the vapor-phase boundary (dew point). You can vary the temperature for the diagram. Click and drag the black dot to change the benzene mole fraction and the temperature or pressure. The bar chart shows the moles of liquid (blue) and vapor (green) in equilibrium and the mole fraction of benzene in each phase ( for liquid phase, for vapor phase). The system contains a total of 1 mol. The activity coefficients used in the modified Raoult's law are calculated using the two-parameter Margules model.
P-x-y
T-x-y
P-x-y
x
B
y
B
Details
Details
The saturation pressure of component is calculated using the Antoine equation:
i=(1,2)
sat
P
i
A
i
B
i
T+
C
i
10
where , , and are Antoine constants, is temperature (°C), and is in bar.
A
i
B
i
C
i
T
sat
P
i
The two-parameter Margules model is used to calculate the activity coefficients for a non-ideal liquid mixture of benzene and ethanol . This model fits the excess Gibbs free energy:
1
2
E
G
RT
x
1
x
2
A
21
x
1
A
12
x
2
where is excess Gibbs energy, and is the ideal gas constant.
E
G
R
The activity coefficients , are given by:
γ
1
γ
2
ln=(+2(-))
γ
1
2
x
2
A
12
A
21
A
12
x
1
ln=(+2(-))
γ
2
2
x
1
A
21
A
12
A
21
x
2
where and are the liquid mole fractions of benzene and ethanol and +=1, and and are the Margules parameters.
x
1
x
2
x
1
x
2
A
21
A
12
The modified Raoult's law is used to calculate the bubble-point and dew-point pressures using the factors:
K
K
i
y
i
x
i
γ
i
sat
P
i
P
where is the vapor mole fraction and +=1, and is the total pressure (bar).
y
i
y
1
y
2
P
Bubble-point pressure calculation:
P=+
x
1
γ
1
sat
P
1
x
2
γ
2
sat
P
2
Dew-point pressure calculation:
P=+
-1
y
1
γ
1
sat
P
1
y
2
γ
2
sat
P
2
The screencast video at[2] shows how to use this Demonstration.
References
References
[1] J. R. Elliott and C. T. Lira, Introductory Chemical Engineering Thermodynamics, New York: Prentice Hall, 2012 pp. 372–377, 430.
[2] Vapor-Liquid Equilibrium Diagram for Non-Ideal Mixture. sites.google.com/a/learncheme.com/learncheme/simulations/thermodynamics/thermo-2/vle-diagram-for-non-ideal-mixtures.
External Links
External Links
Permanent Citation
Permanent Citation
Rachael L. Baumann, John L. Falconer, Nick Bongiardina
"Vapor-Liquid Equilibrium Diagram for Non-Ideal Mixture"
http://demonstrations.wolfram.com/VaporLiquidEquilibriumDiagramForNonIdealMixture/
Wolfram Demonstrations Project
Published: June 17, 2014