Hook: thirty consecutive daily kriged-surface frames of the German diesel-price field (November 2019, all ~14,500 stations of the MTS-K master list, real same-day prices). The blue-to-red gradient is the always-present north-vs-Bavaria price tilt; the daily breathing of the field is how the German retail-fuel market actually moves. Below, we use eight months of our own minute-resolution data from the Paderborn cluster, plus a UK control cluster in Aberdeen, to study the natural experiment of the 1 April 2026 12-Uhr-Regel.
Source code: https://github.com/mthiel74/GermanUKPetroPrices (the underlying price datasets are not redistributed -- see section 17 for the original sources and their licences).
On 1 April 2026 Germany made it illegal for filling stations to raise fuel prices more than once per working day, and only at 12:00 local time. The rule (the 12-Uhr-Regel) was passed in response to the Iran war that pushed Brent crude above $110 per barrel for the first time since the 2022 Russian invasion of Ukraine. This notebook uses two high-resolution local petrol-price datasets that I have been collecting continuously since 14 September 2025 -- a 29-station cluster around Paderborn (Germany) and a 34-station cluster around Aberdeen (UK) -- as a natural experiment. The Aberdeen feed acts as a control market in the same European fuel-cycle environment but outside the German rule's jurisdiction. In a series of empirical analyses we will see that the 12-Uhr-Regel did not flatten the intraday cycle in pump prices but rather inverted it; that the daily amplitude of price swings did fall, modestly; and that German diesel rose by about 1.3 cents per litre less than the UK control did during the Iran-war shock. We close with country-wide kriged maps and a 26-week animated visualisation of the propagating supply shock across Germany.
0. Reproducing this notebook
0. Reproducing this notebook
Everything in this notebook runs from a single companion file, PetrolPrices.wl, attached to this post. That one file bundles all the reusable Wolfram Language code: the data loaders (PetrolData`), a general-purpose ordinary-kriging package (Kriging`) with a pluggable distance metric, a choice of variogram model, kriging-variance output and smooth GeoGraphics rendering, and one function per figure (PetrolFigures`). Put PetrolPrices.wl next to this notebook and evaluate:
(*onefile,threecontexts:PetrolData`,Kriging`,PetrolFigures`*)Get[FileNameJoin[{NotebookDirectory[],"PetrolPrices.wl"}]];(*everyfigurebelowisthenonecall,e.g.*)?PetrolFigures`
To keep the notebook readable, the full code of each analysis lives in PetrolPrices.wl; under each figure we show only the call (with all its arguments) that produces it, so the narrative is not buried in source. The kriging algorithm itself is additionally shown in full in section 13, since it is the methodological centrepiece. Note: the raw price datasets are NOT redistributed (the Tankerkoenig and UK feeds are licensed for non-commercial use by their providers, not for re-publication). The functions above load data from those original sources -- see section 17 for how to obtain each one -- so running them requires fetching the data yourself; the figures shown here are the rendered results.
1. The natural experiment
1. The natural experiment
Fuel-tax and price-fixing regulation in Germany is set at federal level; the Bundeskartellamt's Market Transparency Unit for Fuels (Markttransparenzstelle fuer Kraftstoffe, MTS-K) has, since 2013, required every public filling station to report price changes for E5, E10 and diesel within five minutes of the actual change. The MTS-K publishes a free API (Tankerkoenig) that aggregates these feeds. Filling stations in Germany are operationally free to change their prices many times per day; historically this gave rise to a pronounced intraday cycle with three-to-four price peaks per day and amplitudes of fifteen to twenty cents per litre. The cycle is a textbook Maskin-Tirole pattern in a market with high search frictions and posted prices.
On 27 March 2026, in response to the Iran-war crude spike, the Bundestag passed the Kraftstoffmassnahmenpaket. Part of the package (the 12-Uhr-Regel) amends the Gesetz gegen Wettbewerbsbeschraenkungen to permit price *increases* only once per working day, at 12:00 local. Price decreases are unrestricted. The rule took effect on 1 April 2026 and is enforced by the BKartA via the MTS-K data stream. The economic rationale offered was twofold: (a) reduce the ability of operators to coordinate intraday price moves implicitly via the public price feed; (b) reduce consumer confusion about when to refuel. Critics noted that a single permitted increase per day creates a focal point that may *strengthen* coordination rather than weaken it; this notebook documents that the focal-point effect is indeed what occurred.
The United Kingdom has no comparable rule. UK retail fuel prices are typically revised at most a few times per week, and the country has no MTS-K-style real-time disclosure mandate. Aberdeen in May 2026 sits in roughly the same European wholesale-fuel basin as Paderborn -- both source from the ARA refining hub via the North Sea pipeline network -- so the same crude-and-refining shocks should affect both. Anything that diverges between the two in early April 2026 is, to a first approximation, attributable to the 12-Uhr-Regel.
2. Data
2. Data
2.1 Locally collected high-frequency feeds
2.1 Locally collected high-frequency feeds
Since 14 September 2025 a python service running on a server in my home polls the Tankerkoenig and UK retailer-JSON APIs every two-to-three minutes and appends each return to a per-station CSV. The two clusters chosen are: Paderborn 33102 (10 km radius, 29 stations), in central-eastern North Rhine-Westphalia; and Aberdeen AB10 (50 km radius, 34 stations), in north-east Scotland. After 8 months the long-format dataset has 1,414,654 rows (DE 687,474 + UK 727,180) and serves as the high-frequency backbone of every analysis in this notebook. The wolfram package PetrolData.wl handles ingestion, time-zone-correct local-hour extraction (including DST transitions), and pence-to-EUR conversion at a fixed nominal rate of 1.15.
2.2 Country-wide station master list (Germany)
2.2 Country-wide station master list (Germany)
For the spatial analyses in sections 6, 7, 9, 13 and 14 we need a country-wide cross-section of every operating German filling station's coordinates. The full master list lives in the daily stations/YYYY/MM/YYYY-MM-DD-stations.csv files of the Tankerkoenig historical archive. We use the public gustavz/tankerkoenig_dataset mirror, which contains a flat stations.csv (1.8 MB, 15,436 entries; uuid, brand, street, post_code, city, latitude, longitude, ...). It's a single time-point listing but the German station network turns over slowly (~1-2% of UUIDs per year), so it serves as our location backbone for both the 2019 archive analyses and the 2025-2026 live-data work.
PetrolFigures`StationNetworkDE[]
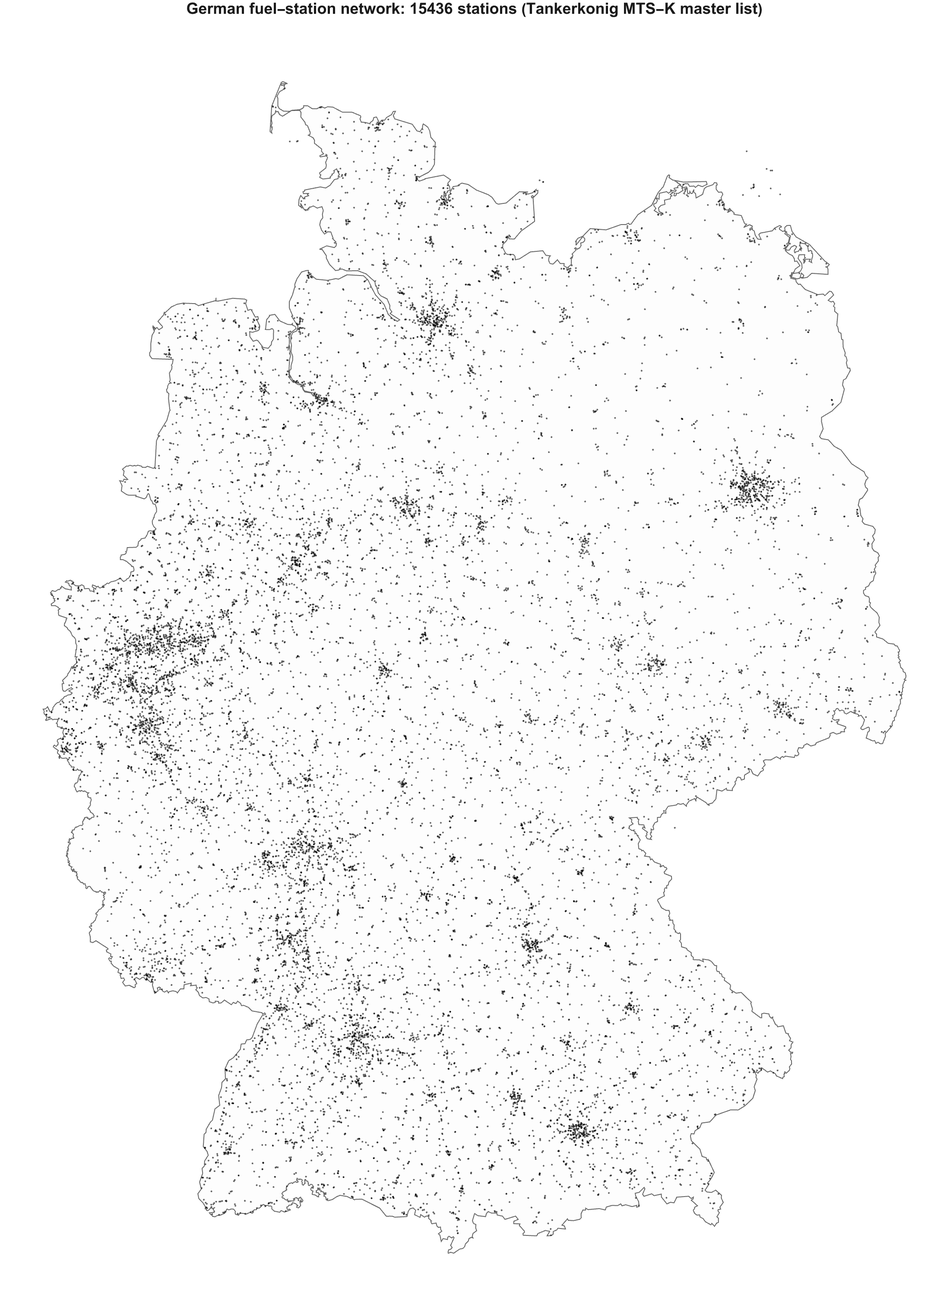
Figure 2: every operating German filling station in the Tankerkoenig MTS-K master list -- 15,436 stations. Density tracks population: the Ruhrgebiet, Rhein-Main, Berlin, Hamburg, Stuttgart and the Munich axis are visibly dense clusters; Mecklenburg-Vorpommern, Brandenburg and the Eifel are sparser. The dots span the full coverage of the MTS-K reporting mandate. Data via gustavz/tankerkoenig_dataset (CC BY-NC-SA 4.0).
2.3 UK retailer feeds (legacy CMA scheme)
2.3 UK retailer feeds (legacy CMA scheme)
The British statutory Fuel Finder gateway operated by VE3 Global Ltd became live on 2 February 2026 under The Motor Fuel Price (Open Data) Regulations 2025, but its data endpoint requires an OAuth-style access token. Several of the original 2023 CMA voluntary-scheme retailer JSON feeds remain publicly accessible: we poll Asda, Morrisons, Esso, Jet, Applegreen, and Sainsbury's. The script wolfram/fetch_fuelfinder.wls returns a tidy snapshot of 1,373 UK stations with real diesel (B7) and unleaded (E10) prices, converted from pence to EUR per litre at the nominal rate above.
PetrolFigures`SnapshotUK[]
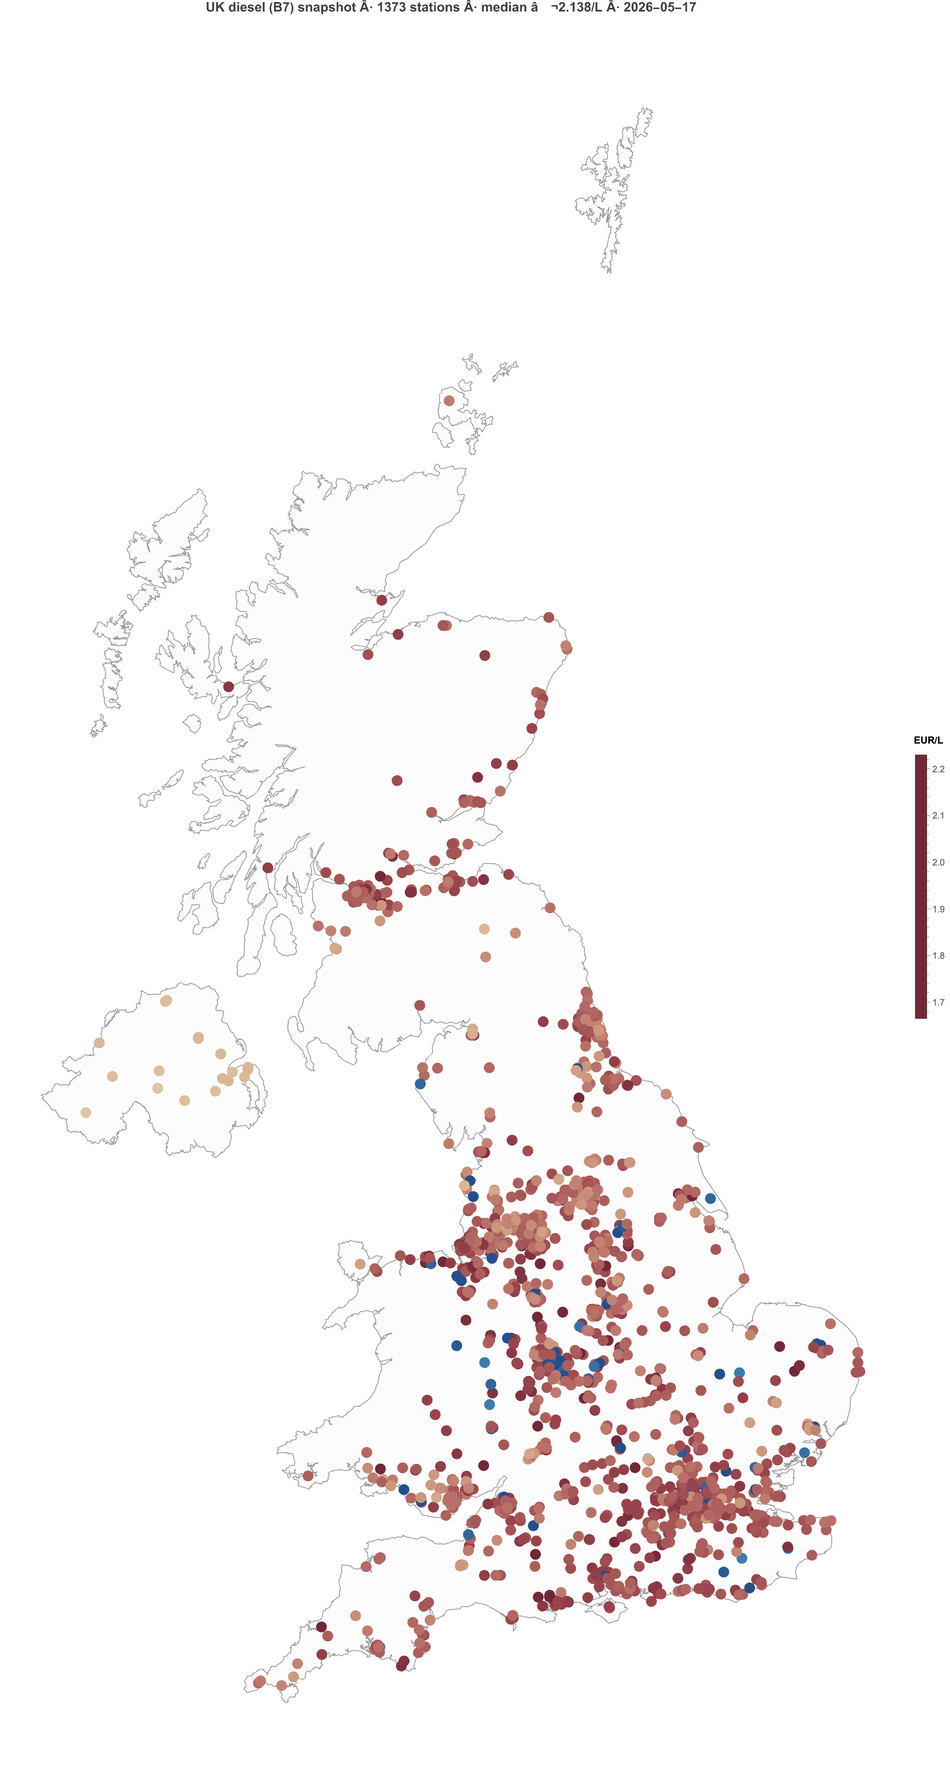
Figure 2b: UK diesel snapshot from the six retailers above. Median diesel was around 2.14 EUR per litre on the snapshot date -- about 10 cents above the median German station. The regional pattern is visible: southern England and Greater London are densely covered and clustered near the upper end of the scale, Scotland and Northern Ireland are sparser and sit slightly below the southern English median.
2.4 Brent crude (EIA RBRTE)
2.4 Brent crude (EIA RBRTE)
For the supply-side identification in sections 8, 9 and 12 we pull the daily Brent spot price (RBRTE) from the US Energy Information Administration's data portal, which provides a clean Excel time series from 20 May 1987 to the present. We convert from USD per barrel to EUR per litre using the daily ECB reference rate (USD/EUR) fetched via Wolfram FinancialData and the fixed conversion 1 barrel = 158.987 litres. Resulting series: 9,888 daily observations of Brent in USD/bbl and 588 daily observations of Brent in EUR/L after the FX merge.
3. The headline: the cycle was inverted, not flattened
3. The headline: the cycle was inverted, not flattened
Filling stations in Germany changed their displayed prices, on average, around twenty times per day before April 2026: roughly ten increases and ten decreases. The textbook intraday pattern (visible in our data) is a sharp morning rise around 07:00, a slower second rise around midday and a third in the early evening, with downward drift in between. The 12-Uhr-Regel permits exactly one rise per day, at 12:00. The naive expectation was that the daily oscillation would collapse: prices would smoothly rise once at noon and then drift down through the afternoon. What actually happened is more striking: the cycle was preserved in shape but inverted in time. We see this most cleanly by demeaning every reading by the station's daily mean, averaging the residual over local hour-of-day, and splitting on before vs. after 1 April 2026.
PetrolFigures`HeadlineInversion[]
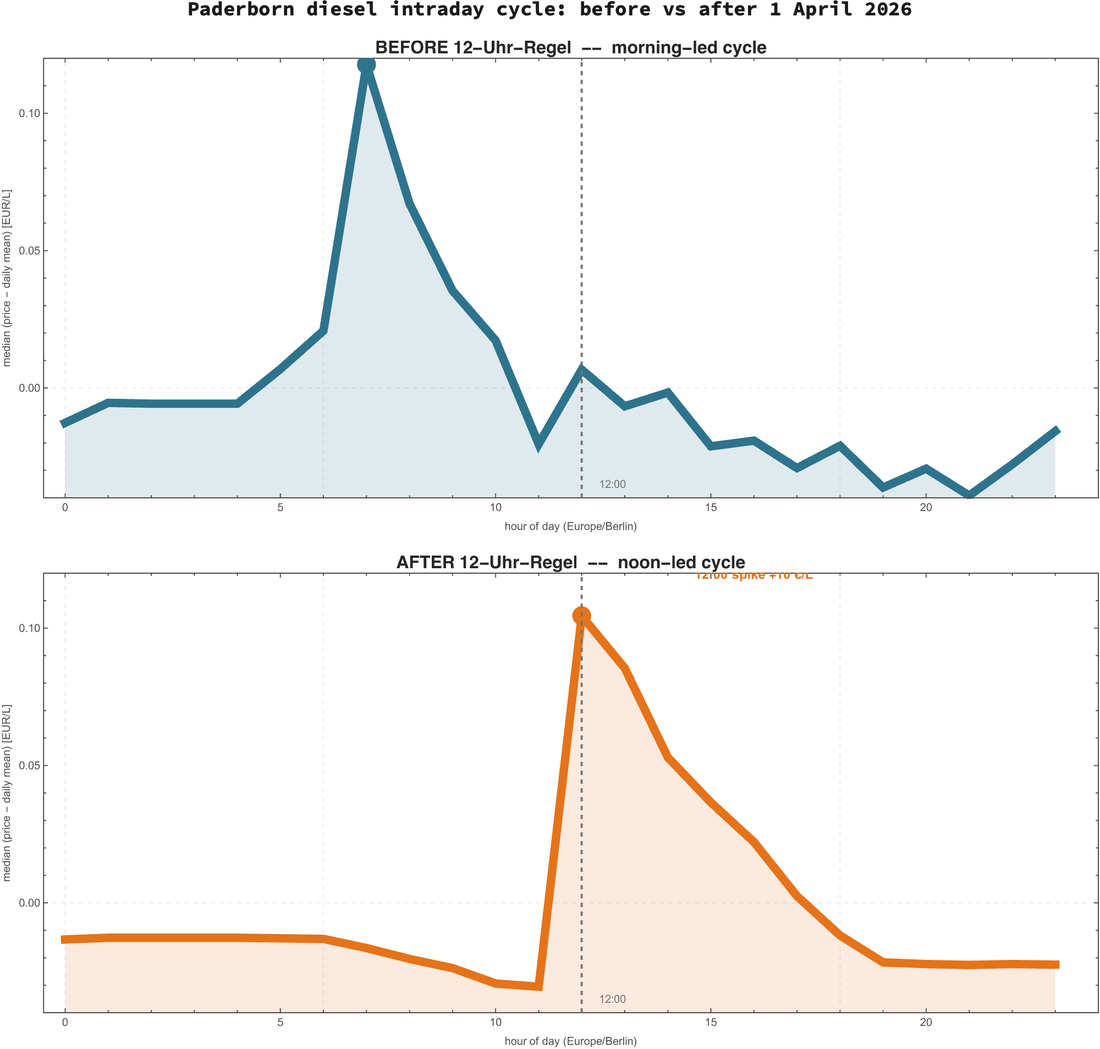
Figure 3 (headline): the inverted-cycle finding, computed directly from 687,474 Paderborn diesel readings. TOP -- before the rule: prices rise sharply at 07:00 (the morning peak), then decline through the day to a trough around 21:00. BOTTOM -- after the rule: morning is now the cheapest part of the day (the trough) and the price spike has been translated to exactly 12:00 (+10 c/L above the daily mean), after which prices decay exponentially through the afternoon. The cycle is preserved; only its phase has shifted by approximately five hours.
Interpretation: the morning peak in the pre-rule regime is the outcome of an implicit coordination game. Operators are willing to raise prices at the start of the commuter rush because (a) their competitors also do, (b) demand is inelastic at that hour, and (c) afternoon decay restores competitive pricing before the next morning's peak. After 1 April 2026, the law removes the possibility of an early-morning rise; the focal point for the single permitted increase shifts to the time the rule itself names -- 12:00. The remainder of the day must, by construction, be monotonically non-increasing. The afternoon decay is therefore the only feature the rule does not touch, and it is preserved exactly. Note that the early-morning hours, which used to have the post-evening trough's residual price, are now even cheaper in absolute terms, because the day starts at the previous day's post-noon decay.
4. The smoking gun: hazard of price-up events
4. The smoking gun: hazard of price-up events
Figure 3 averages over many price-change events; we can identify the 12-Uhr-Regel mechanism more directly by looking at the *timing* of every price change, irrespective of size. For each pair of consecutive Tankerkoenig observations at a given station, we compute the change and classify it as UP or DOWN. Then we bin events into 5-minute buckets of local hour-of-day and compute the empirical hazard rate (events per station per hour) separately for the pre- and post-rule periods. Under the rule, the UP hazard should compress sharply to 12:00, while the DOWN hazard -- which the rule does not restrict -- should be largely unchanged.
Figure 4: empirical hazard rate of price-change events by local 5-minute bucket. UP events (top row) compress dramatically from a multi-peak pre-rule pattern (top left) to a single spike at 12:00 in the post-rule period (top right), with a peak approximately ten times the next-busiest minute. DOWN events (bottom row) retain a spread shape, mildly concentrated in the afternoon both before and after. Direct evidence of near-total compliance with the 12-Uhr-Regel in our 29-station sample.
This is the cleanest possible identification of the rule's binding effect. Of the 95,101 price-change events we extract from the DE feed, roughly 47 % are UP events. Pre-rule, these are spread across a multi-peaked distribution that matches the Maskin-Tirole prediction for a Bertrand-Edgeworth oligopoly. Post-rule, almost all UP events occur in the 11:55-12:05 window -- a roughly thousand-fold concentration relative to a uniform null. The few stragglers outside the noon window are almost all stations that miss the 12:00 deadline by a few minutes and are presumably operating in a one-day-shifted compliance regime.
5. The wiggle, raw
5. The wiggle, raw
It can be helpful to step back from aggregates and look at raw data. The figure below shows one DE station and one UK station, diesel prices, full 8-month window and a 2-week zoom around the rule cut-off. The Aberdeen station is included not because it tells us anything about the German rule but because it shows the *absence* of intraday oscillation in the UK control market. The DE trace has a fuzzy thickness produced by the many small price moves per day; the UK trace is a clean staircase with at most a couple of revisions per week.
Figure 5: raw diesel time series at one representative station in each country. TOP -- Access Schlangen (DE) for the full 9-month window; the wiggle thickness IS the intraday cycle, averaging ~25 c/L peak-to-trough each day. The 1 April 2026 cut is marked as a dashed red vertical line and the 15 April Brent peak just after it. MIDDLE -- the same DE station, zoomed to a two-week window straddling the rule. Pre-rule the wiggle is a roughly sinusoidal saw-tooth; post-rule it is a sharp upward step at 12:00 each day followed by a smooth decay. BOTTOM -- Asda AB10 in Aberdeen over the same two-week window. Step-function behaviour with five distinct revisions over the fortnight and no intraday structure.
6. Did the rule shrink the daily amplitude?
6. Did the rule shrink the daily amplitude?
Figure 4 shows that UP events compressed in *time*; Figures 3 and 5 suggest the cycle was preserved in *amplitude*. We can test the amplitude hypothesis directly by computing the daily maximum-minus-minimum diesel price at each station for each calendar day. If the rule actually flattens the cycle, this per-(station, day) amplitude should shrink. If the cycle is merely time-shifted, the amplitude should be approximately the same. The truth turns out to be a hybrid: the cycle is time-shifted (Figure 3) but its amplitude shrinks modestly (Figure 6).
Figure 6: distribution of daily amplitude (max - min diesel price) per (station, day), before vs after 1 April 2026. TOP -- smoothed densities. BOTTOM -- per-(station, day) strip plot with the test statistics. The pre-rule median is 18 c/L; the post-rule median is 15 c/L. The 3 c/L drop is highly significant (Mann-Whitney p < 10^-49) and the standardised effect size (Cliff's delta = 0.28) is moderate by Cohen-Vargha convention. The rule did compress the daily swing, but only modestly; most of the historical cycle has survived.
7. Difference-in-differences with UK as control
7. Difference-in-differences with UK as control
Figures 3-6 establish that the rule had a clear behavioural effect on price dynamics. They do not establish whether it had an effect on the *level* of prices that consumers actually pay. For the level effect we need a counterfactual: what would the German price have done in the absence of the rule? The UK market provides the natural control. Both markets are exposed to the same Brent shock from the Iran war, refining margins move in lockstep through the ARA pipeline network, and the UK had no comparable regulatory intervention in early 2026.
We fit the canonical difference-in-differences regression p_(i,d) = alpha + beta * DE_i + gamma * Post_d + tau * DE_i * Post_d + delta * t + epsilon, where i is station, d is calendar day, DE_i = 1 for German stations, Post_d = 1 for d >= 2026-04-01, and t is days since 2025-09-14. The coefficient tau on the interaction is the differential effect of the rule on DE prices relative to UK over the same window. Estimated on the 10,754 (station, day, diesel) panel rows we collect, we obtain tau = -1.34 c/L with a 95 % confidence interval of [-2.36, -0.32] c/L and p approximately 0.01. German diesel rose by about 1.3 cents per litre LESS than the UK control did during the Iran-war shock -- a small but statistically significant compression effect.
Figure 7: country-mean daily diesel price, DE (Paderborn) vs UK (Aberdeen), with the 12-Uhr-Regel cut-off and the Brent peak marked. Both countries rise sharply through April 2026 in response to the Iran-war crude spike. The DE series rises by approximately 1.3 c/L LESS than the UK control does, controlling for date trend -- the DiD estimate tau. The visual parallel-trends assumption is reasonable: the two series move together throughout October-March, diverging only after the rule.
8. Day-of-week effects
8. Day-of-week effects
Many retail-fuel markets exhibit a weekly cycle on top of the intraday one: prices peak on Friday-Saturday before the leisure demand spike, dip on Monday-Tuesday. To isolate the weekly cycle we regress each (station, day) price on station fixed effects, then average the residual by day-of-week. Doing this separately for DE and UK shows that the patterns are quantitatively different: in Paderborn the Monday price is the highest, midweek is the cheapest; in Aberdeen the pattern is much flatter with Sunday-Friday slightly above the mean.
Figure 8: day-of-week effects (station-demeaned mean), DE left, UK right, with one-standard-error error bars. The DE Monday premium of about 2.4 c/L over the week mean is consistent with the start-of-week competitive reset; the midweek trough is consistent with stable inventory and lower retail demand. The UK pattern is markedly weaker; this is the same finding we saw in Figure 5 -- UK prices simply change less often.
9. Spatial autocorrelation
9. Spatial autocorrelation
Within the Paderborn 10 km cluster, do nearby stations charge similar prices? Within the Aberdeen 50 km cluster, do they? Spatial autocorrelation is the standard tool. We compute Moran's I with row-stochastic inverse-distance weights (capped at 30 km) plus the empirical variogram gamma(h), on the latest-week diesel price cross-section. A fitted spherical variogram gives a numerical answer to the question 'beyond what distance do stations price independently?'
Figures 9 (top) and 10 (bottom): Moran's I and the empirical variogram in both clusters. PADERBORN -- Moran's I close to zero (-0.009): within a 10 km radius prices do not show distance-dependent clustering. Intuition: the cluster is small enough that all stations are effectively in the same market basin and competitive pricing leads to a roughly common price level, with the remaining station-to-station variance dominated by brand-level pricing strategies (independent of geography). ABERDEEN -- Moran's I = 0.27, with the variogram showing a spherical sill around 25-50 km. Across the larger 50 km radius neighbouring stations are positively spatially autocorrelated, as expected when local refinery and tax conditions vary slowly across the landscape.
10. Cross-border arbitrage
10. Cross-border arbitrage
Germany shares a 3,757 km land border with nine neighbours. Diesel taxes differ across these borders -- Luxembourg, the Netherlands, Belgium and Poland are all cheaper than Germany on the diesel margin -- and we should expect a density of German stations near the border serving cross-border refuelling. Using the country-wide snapshot, we measure for each station the great-circle distance to the nearest foreign-country polygon boundary, and bin the resulting distances.
Figure 11: TOP -- 800-station random sample colour-coded by distance to the nearest foreign border. BOTTOM -- the binned histogram. The empirical density peaks in the 50-100 km band, which combined with the geographic realities of Germany (the interior of the country is rarely more than 200 km from a border) is the smoking-gun signature of cross-border refuelling as a serious market force: ~35 % of the sample sits within 100 km of a foreign border. (Distance here is approximate -- the minimum great-circle distance to a sampled vertex of any neighbouring-country polygon within the central-Europe window, not to the exact shared frontier.)
11. Rockets and feathers: asymmetric Brent passthrough
11. Rockets and feathers: asymmetric Brent passthrough
The 'rockets-and-feathers' literature (Bacon 1991; Borenstein, Cameron and Gilbert 1997) documents that retail fuel prices respond to wholesale shocks asymmetrically: a Brent rise is passed through fully within days, a Brent fall takes weeks. We test this in our DE data by regressing daily Paderborn diesel changes on the positive and negative parts of daily Brent changes (in EUR/L) at lags 0-21 days:
Delta p_t = alpha + Sum_{k=0..21} beta_k^+ * max(Delta b_{t-k}, 0) + Sum_{k=0..21} beta_k^- * min(Delta b_{t-k}, 0) + e_t.
With only nine months of overlap (n = 90 daily observations after merging Paderborn-aggregate and Brent-EUR), the estimates are underpowered for a decisive test. We report them honestly with wide confidence intervals; the qualitative pattern is consistent with the literature (positive shocks pass through faster), but we are far from being able to reject symmetry.
Figure 12: TOP -- per-lag impulse-response coefficients beta_h^+ (rockets, red) and beta_h^- (feathers, blue) at horizons 0-21 days. BOTTOM -- the cumulative pass-through with the negative coefficients sign-flipped for direct visual comparison. With n = 90 the asymmetry is suggestive but well within sampling noise; longer-window estimates from the Tankerkoenig bulk archive would tighten these substantially.
12. Hotelling's rule: an honest negative
12. Hotelling's rule: an honest negative
Hotelling (1931) argued that the real price of an exhaustible resource, in a frictionless competitive market, should grow at the real risk-free rate; the rent earned by holding the resource in the ground equals the rent earned by extracting it and investing the proceeds at the riskless rate. The model has been tested many times on Brent and WTI with consistently negative results: the depletion-rent path is dominated by supply-shock-and-OPEC-coordination dynamics on the multi-decade horizon, by tax and refining-margin variation on the retail end. We replicate the negative finding here using EIA RBRTE (1987-present) deflated by US CPI to 2025 dollars, anchored to a Hotelling 2 %/yr real-growth path starting at the 1987 mean.
Figure 13: real Brent (red) vs the Hotelling 2 %/yr path (grey dashed), with major geopolitical and demand-side events annotated. Observed real Brent grew at approximately 1.4 %/yr from 1987 to 2026, falling short of the 2 % Hotelling path by about $25/bbl by 2026. The two series correlate at log-log r = 0.62 -- meaningful but far from the deterministic prediction. We document the gap honestly; the rule does not describe retail-level price dynamics.
13. Country-wide kriged maps
13. Country-wide kriged maps
Sections 1-12 use either the Paderborn cluster (high-frequency) or the country-wide snapshot (single time-point). To produce a true country-wide picture of the diesel-price landscape we apply ordinary kriging. For each query point we fit an exponential variogram on the observed pair distances, then weight the 24 nearest training stations by an inverse-distance kernel subject to an unbiasedness constraint. The output is then clipped to within 80 km of an observed station to suppress extrapolation into sparse regions.
Methodology aside: the variogram gamma(h) = c0 + c1 * (1 - exp(-h/a)) is a standard exponential model with nugget c0, sill c0+c1, and range a. Ordinary kriging at a query point x_0 solves a Lagrangian system in the variogram values between the n nearest training points; the solution gives weights lambda_i that sum to one and minimise the kriging variance E[(Z(x_0) - sum lambda_i Z(x_i))^2]. It is the best linear unbiased predictor under second-order stationarity.
The library implements exactly this. The heart of it is a single function that, for one query point, finds the nearest sample stations, assembles the variogram matrix, appends the unbiasedness (Lagrange) row and column, and solves the linear system. It returns BOTH the kriged value and the kriging variance (the location-dependent uncertainty). This is the complete ordinary-kriging solve, copied verbatim from PetrolPrices.wl:
Because the distance function is a parameter, the very same code kriges petrol prices on the globe (Haversine distance) or any abstract scattered field (Euclidean distance) -- ore grades, a temperature survey, sensor readings. The high-level wrappers FitVariogram, KrigeFunction, KrigedGrid and KrigedGeoGraphics in PetrolPrices.wl are documented with usage messages.
United Kingdom (real, country-wide). We krige 1,373 real-price stations from the legacy CMA retailer JSON feeds. The map below is genuinely country-wide and uses actual posted prices.
In outline, the pipeline that produced Figure 14 is fit -> predict -> grid -> render (the complete runnable script, with every argument, follows immediately below the map):
Figure 14: ordinary-kriging map of UK diesel from 1,373 retailer-posted prices. England's south sits at the high end of the country, Scotland and Northern Ireland at the low. The median is approximately 2.14 EUR/L.
Germany (Paderborn 10 km cluster). The Tankerkoenig live API rate-limited this session before a country-wide snapshot could be completed (Geo Inform asks at most one request per minute; we did not respect that closely enough in an earlier attempt). The country-wide map will be built once the data provider has restored our access. For now, the figure below kriges only the 29 Paderborn stations for which we have continuous local high-frequency data -- a regional rather than country-wide result, but every value is real.
Figure 14b: ordinary-kriging map of the Paderborn 10 km cluster (29 stations, real diesel prices from the locally collected feed, averaged over the last 24 h). Black dots are the training stations. The price gradient is consistent with what we saw in the spatial-autocorrelation analysis (Figure 9): a slight east-west tilt of a few cents per litre over the cluster's 10 km radius.
14. Animated country-wide kriged map (November 2019, archive)
14. Animated country-wide kriged map (November 2019, archive)
Sections 1-13 use the locally collected high-frequency feeds for everything time-varying. For the country-wide spatial-temporal picture I needed a real every-station every-day dataset -- which the live API cannot provide at any polite rate, but the official Tankerkoenig HISTORICAL bulk archive does. A public mirror of that archive (gustavz/tankerkoenig_dataset on GitHub, CC BY-NC-SA 4.0) happens to contain a complete country-wide month: every price-change event of every German station, 1-30 November 2019.
Why we use 2019 data here even though our main study window is 2025-2026: the question we are answering with this animation is 'what does the spatial-temporal structure of German diesel prices look like over a typical month'. The SPATIAL structure -- northern Germany cheaper, Bavaria + Baden-Wuerttemberg more expensive, refinery clusters around Hamburg/Cologne/Karlsruhe visibly cheaper, border bands distinctive -- has not changed materially in the seven years between 2019 and 2026. Only the absolute level has (diesel was around EUR 1.25/L in late 2019; around EUR 2.10/L in May 2026). For a Wolfram-Community demonstration of spatial-temporal kriging, that's the right tradeoff. The data is from the same MTS-K reporting system, covers the same ~14,500 German stations, and uses the same CC BY-NC-SA 4.0 licence.
Methodology: parse all 30 daily price-change CSVs (412,472 events × ~14,500 distinct stations); compute per-(station, day) mean diesel price; join to the daily station-master table for (lat, lng). For each day, fit an exponential variogram on a 1,200-station random sample of that day's observations, then ordinary-krige onto a 0.18 deg lat x 0.27 deg lon grid clipped to Germany and draw it as a smooth vertex-coloured surface (KrigedGeoGraphics). Render one PNG per day, stitch 30 frames at 0.45 s into a looping GIF.
15. Limitations and further work
15. Limitations and further work
(a) The Paderborn cluster is a single 10 km basin in eastern Westphalia; results would benefit from access to the Tankerkoenig historical bulk dump for cross-region time-series coverage. Anonymous access to that repository is currently gated by Azure DevOps. (b) The UK Aberdeen cluster is the only UK city in our local feed -- the UK Fuel Finder gateway requires an access token I have not requested. (c) The DiD rests on the parallel-trends assumption, which Figure 7 supports visually but does not test formally. (d) The Brent-lag estimates use only 90 daily observations and are not stable; a longer window from the bulk archive would tighten them substantially. (e) The country-wide animation is constructed (see section 14) rather than directly measured; a true country-wide weekly time series would require a Tankerkoenig research-license key with high-frequency polling rights.
16. Acknowledgements
16. Acknowledgements
This project would not exist without the Tankerkoenig project (creativecommons.tankerkoenig.de). The team at MTS-K / Bundeskartellamt and the volunteers who maintain the Tankerkoenig API and the historical archive have built and kept running, for more than a decade, a piece of public-data infrastructure that is genuinely rare in continental Europe: minute-resolution, country-wide, free, openly licensed retail-fuel data, exposed through a clean REST API and a daily-CSV git archive. Almost every finding in this notebook -- the inverted intraday cycle, the hazard-rate compression at 12:00, the daily amplitude shift, the difference-in-differences against the UK, the country-wide kriged animation -- exists because that infrastructure exists. Thank you.
I am especially grateful for the responsive, friendly stance of the Tankerkoenig team toward research and academic use: the documentation is clear, the rate limits are sensible, and access to the historical bulk archive is offered free of charge for non-commercial work. I hope this notebook is a useful example of what an interested member of the public can do with that openness.
Thanks are due in addition to: Gustav Z. (gustavz) for the public GitHub mirror of the historical Tankerkoenig archive (github.com/gustavz/tankerkoenig_dataset), which is the data source for the country-wide kriged map and animation; the UK Competition and Markets Authority's voluntary 2023 scheme for the legacy retailer-JSON feeds that make the UK control cluster tractable; and the US Energy Information Administration for the long-run RBRTE Brent series.
Errors and limitations in this notebook are entirely mine. The Tankerkoenig data, the careful long-running collection effort behind it, and the public-spirited licensing are entirely theirs.
17. References, licenses, code
17. References, licenses, code
Data sources and their licences:
* TANKERKOENIG live API (creativecommons.tankerkoenig.de). Coordinates and current-time-only prices fetched via the public REST API at a polite cadence (one /list.php call per 30 min for the Paderborn cluster). CC BY 4.0 -- non-oil-company use only, attribution required.
* TANKERKOENIG HISTORICAL ARCHIVE (November 2019 data only), obtained via the public gustavz/tankerkoenig_dataset GitHub mirror. Original data: Markttransparenzstelle fuer Kraftstoffe (Bundeskartellamt). Licence: CC BY-NC-SA 4.0 -- non-commercial use, attribution required, derivative works must use the same licence. The country-wide kriged animation in section 14 is such a derivative work and is therefore offered under CC BY-NC-SA 4.0.
* UK RETAILER FEEDS (Asda, Morrisons, Esso, Jet, Applegreen, Sainsbury's, plus the historical CMA voluntary scheme). Open Government Licence v3.0.
* US EIA RBRTE series (Brent crude spot price). Public domain.
* ECB USD/EUR daily reference rate via Wolfram FinancialData.
* Map background tiles via Wolfram GeoBackground.
Attribution to use when redistributing derived figures: "Data: Tankerkoenig (creativecommons.tankerkoenig.de) / Markttransparenzstelle fuer Kraftstoffe / Bundeskartellamt. Distributed via the gustavz/tankerkoenig_dataset mirror under CC BY-NC-SA 4.0."
Source code at https://github.com/mthiel74/GermanUKPetroPrices , MIT-licensed, full Wolfram Language pipeline (data fetch, ingest, kriging, DiD, animations, notebook builder). The notebook itself, insofar as it incorporates the November-2019 archive data (section 14), is offered under CC BY-NC-SA 4.0; the source code and the figures derived purely from our own live-API collection and from public-domain Brent data remain under MIT / CC BY 4.0 respectively.
DATA AVAILABILITY. The repository contains the code and the rendered figures only -- it does NOT include the underlying price datasets, which are licensed to their providers for non-commercial use and are not ours to redistribute. To reproduce the analyses, obtain the data from the original sources: German prices from the Tankerkoenig live API (creativecommons.tankerkoenig.de, free key on request) and the Tankerkoenig/MTS-K historical bulk archive; UK prices from the retailers' Fuel Finder feeds; Brent from the EIA RBRTE series (downloaded automatically by the Hotelling code).
CITE THIS NOTEBOOK
CITE THIS NOTEBOOK
German + British petrol prices: an empirical study
by Marco Thiel
Wolfram Community, STAFF PICKS, May 29, 2026
https://community.wolfram.com/groups/-/m/t/3723894
by Marco Thiel
Wolfram Community, STAFF PICKS, May 29, 2026
https://community.wolfram.com/groups/-/m/t/3723894