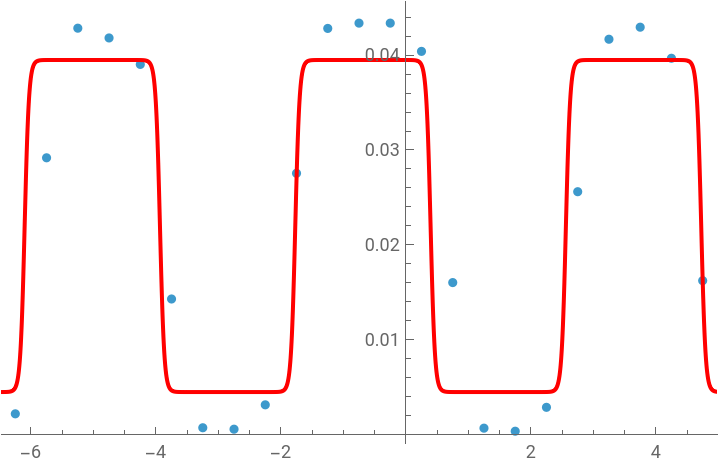
In[]:=
data={{-6.25,0.00219649},{-5.75,0.0291773},{-5.25,0.0428364},{-4.75,0.0418075},{-4.25,0.0390189},{-3.75,0.0142977},{-3.25,0.000728449},{-2.75,0.000577218},{-2.25,0.00314383},{-1.75,0.0275447},{-1.25,0.0428128},{-0.75,0.0433703},{-0.25,0.0433703},{0.25,0.0403935},{0.75,0.0160277},{1.25,0.000686316},{1.75,0.00036222},{2.25,0.00288114},{2.75,0.0256044},{3.25,0.0416728},{3.75,0.0429419},{4.25,0.0396677},{4.75,0.0162309}};
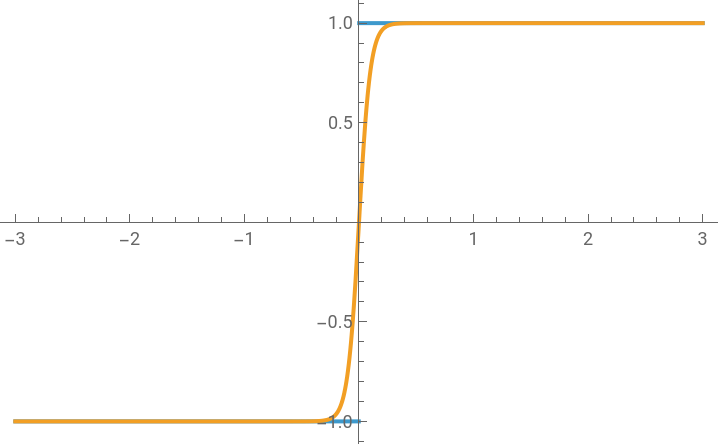
For robustness, approximate the discontinuous Sign function with a smooth function:
In[]:=
Plot[{Sign[x],Tanh[Rx]/.R->10},{x,-3,3}]
Out[]=
In[]:=
fit[R_]:=NonlinearModelFitdata,a*Tanh[R*Sin[k*(x-x0)]]+b,a,,x0,,b,,k,,x,Method->"Newton"//Normal;
21
1000
26
10
21
1000
3
2
In[]:=
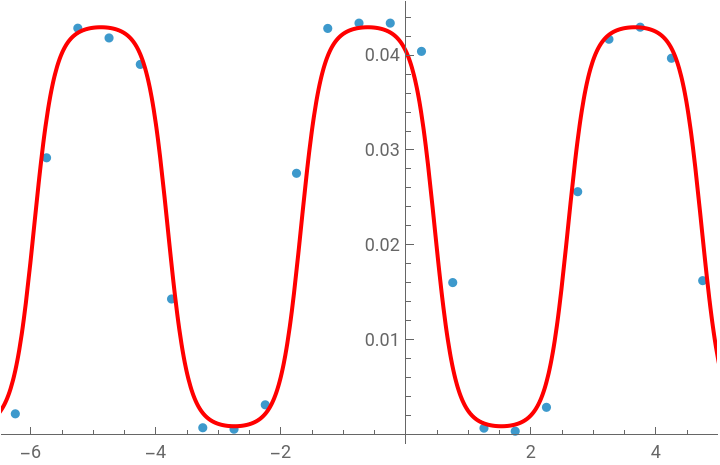
Show[ListPlot[data],Plot[Evaluate@fit[2],{x,-7,7},PlotStyle->Red,ExclusionsNone]]
Out[]=
In[]:=
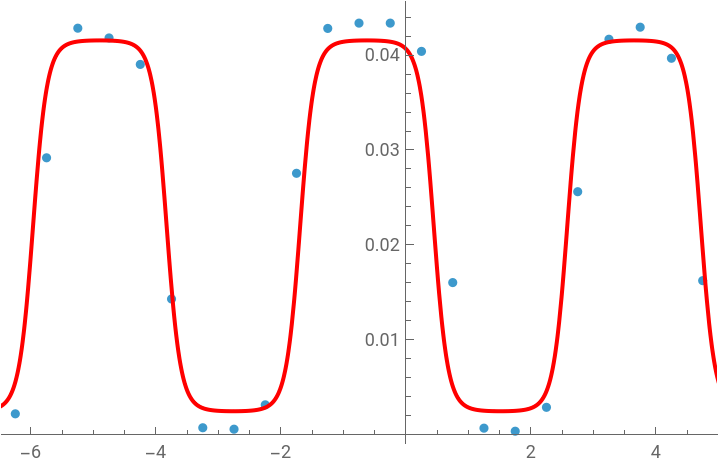
Show[ListPlot[data],Plot[Evaluate@fit[3],{x,-7,7},PlotStyle->Red,ExclusionsNone]]
Out[]=
In[]:=
Show[ListPlot[data],Plot[Evaluate@fit[4],{x,-7,7},PlotStyle->Red,ExclusionsNone]]
Out[]=
In[]:=
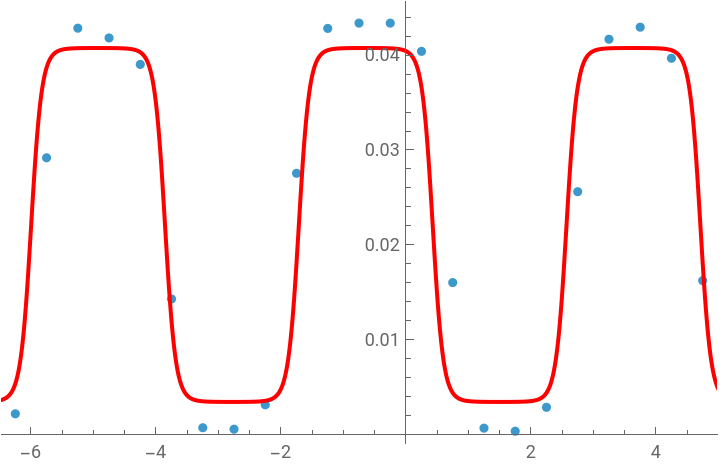
Show[ListPlot[data],Plot[Evaluate@fit[10],{x,-7,7},PlotStyle->Red,ExclusionsNone]]
Out[]=