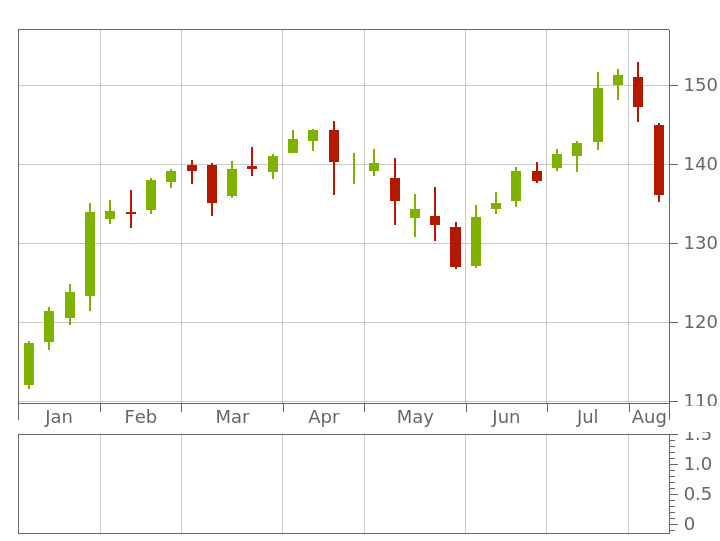
I have the following graphic which was obtained by using the statement:
frames=ParallelTable[TradingChart[data[[1;;n]],PerformanceGoal->”Speed”]
,{n,1,Length@data}];
and frame = Last[frames]
There are 32 candlesticks in the chart
The data is from the stock with ticker “IBM”
frames=ParallelTable[TradingChart[data[[1;;n]],PerformanceGoal->”Speed”]
,{n,1,Length@data}];
and frame = Last[frames]
There are 32 candlesticks in the chart
The data is from the stock with ticker “IBM”
In[]:=
frame=
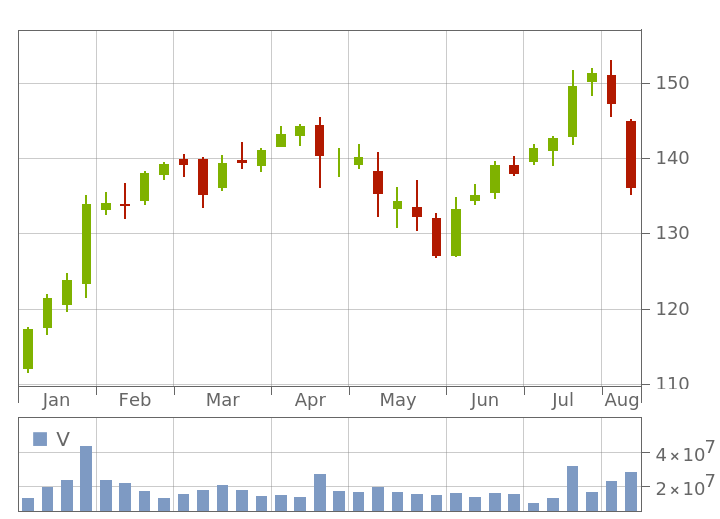
Out[]=
I also have a line defined as
{{6,132.12},{9,140.49},{10,133.58},{12,142.12},{13,138.35},{16,145.39}}
Which is shown as:
{{6,132.12},{9,140.49},{10,133.58},{12,142.12},{13,138.35},{16,145.39}}
Which is shown as:
currentPath={{6,132.12},{9,140.49},{10,133.58},{12,142.12},{13,138.35},{16,145.39}}ll=ListLinePlot[currentPath]
Out[]=
{{6,132.12},{9,140.49},{10,133.58},{12,142.12},{13,138.35},{16,145.39}}
Out[]=
My problem is that I cannot get the 2 plots to be overlaid. The line plot is made up of lines segments between candlesticks #6,9,10,12,13 and 16
So, the bottom chart should be overlaid over the trading chart but smaller so that it would start at the low of candlestick #6 and end at the high of candlestick 16
I have tried Show[frame,ll] and Overlay but cannot get it.
I tried Epilog, but that seems to only work with the the CandlestickChart function.
In[]:=
currentPath={{6,132.12},{9,140.49},{10,133.58},{12,142.12},{13,138.35},{16,145.39}}ticker="IBM";CandlestickChart[{ticker,weekTrainingDateRange},ChartElementFunction->"Candlestick",Epilog->{Black,Line[currentPath],PointSize[Medium],Blue,Point[currentPath]}]
Out[]=
{{6,132.12},{9,140.49},{10,133.58},{12,142.12},{13,138.35},{16,145.39}}
Out[]=
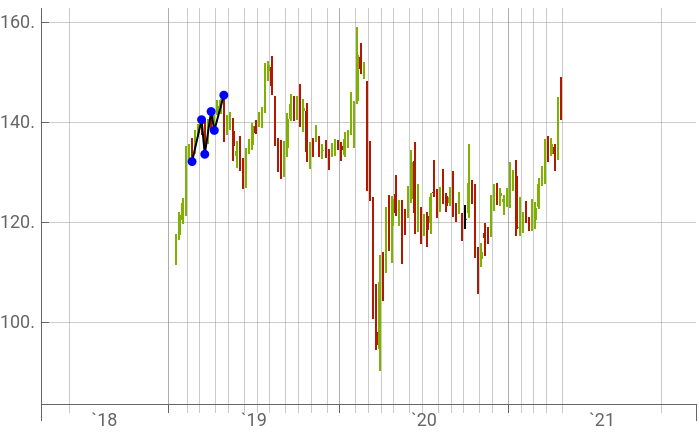
However this is not as nice as what I would like to see. I would really like to have the overlay of the line segments be on top of the frame graphics shown at the top of this notebook. I am going to continue investigating what I might be able to do to have my line segments be displayed on top of frames obtained with the TradingChart[] function.I triedframes = TradingChart[data,Epilog->{Black,Line[currentPath],PointSize[Medium],Blue,Point[currentPath]}]and I only get the following:Which doesn’t have the line segments between points 6, 9, 10, 12, 13, 16Can anyone help?