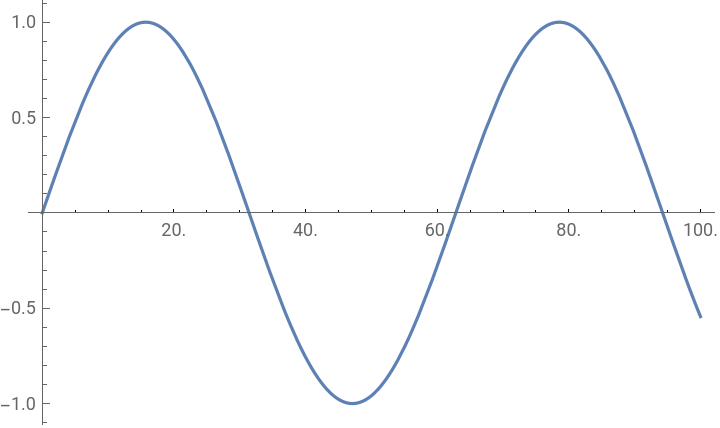
I found these two solutions (not mine!) online:
In[]:=
pl=Plot[Sin[x],{x,0,10}];newTicks=AbsoluteOptions[pl,Ticks][[1,2,1]]/.{n_,lab_?NumberQ,rest__}{n,10lab,rest};Show[pl,Ticks{newTicks,Automatic}]
Out[]=
In[]:=
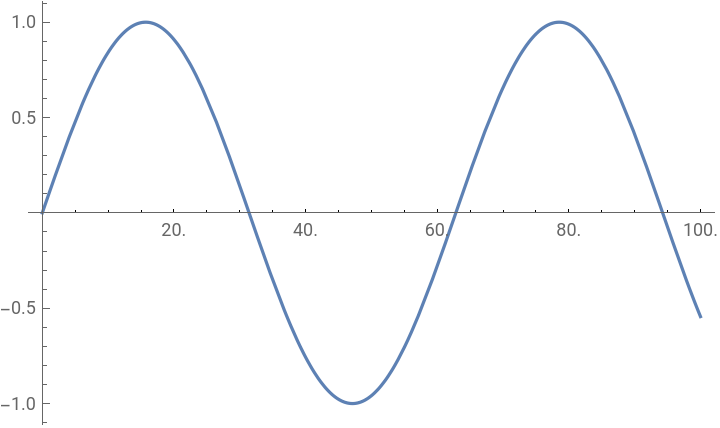
TickScale[plotname_,factor_]:=Map[Times[#,{1,If[NumberQ[#[[2]]],1/factor,1],{1,1},{1,1}}]&,AbsoluteOptions[plotname,Ticks][[1,2,1]]]pl=Plot[Sin[x],{x,0,10},PlotRangeAll];Show[pl,Ticks{TickScale[pl,1/10],Automatic}]
Out[]=