Abstract
Abstract
Non-fungible tokens(NFT’s) are transferrable rights to digital assets, such as collectables, in-game items, art, music, or videos. The phenomenon and its market have grown very well since late 2020. The objective of this project is to analyze the sales of NFT’s and make a live dashboard displaying the data of recently sold NFT’s. Required data for the project is taken from the Open-sea.io API.
Introduction
Introduction
NFT's are a sort of digital ownerships of an asset recorded in the blockchain. These assets can be digital or physical in nature. NFT's are similar in this regard to fungible goods such as cryptocurrencies. However they differ in that fungible goods can be exchanged for goods of the same kind. By contrast, non - fungible items cannot be exchanged for a similar good because they are unique. Prominent examples of non - fungible tokens (NFT’ s), such as the artist Beeple selling his digital art ‘Everydays’ for $69 million (Christie’ s, 2021) and Twitter CEO Jack Dorsey auctioning off his first tweet for $2 .9 million (The Verge), shows NFT’ s have received mainstream attention .
I was first introduced to Blockchain last year, and every time I explore I fall more in love with it. Few months back I read an article named ' What is an NFT? The trendy blockchain technology explained' .That was my first encounter with NFT's, that really caught my attention. From then I want to delve deep into this topic. Finally, I got a chance to create a cool project on NFT's at the Wolfram High School Summer Camp.
My project focuses on analyzing the data of NFT's and making a live dashboard with the most recent sales of NFT's. The Dashboard contains different visualizations showing the data related to NFT collections, prices, transactions and Market cap.
Dataset Creation
Dataset Creation
The given function imports data from the Open Sea events API into RawJSON format and then converts it into a dataset. Initially, I struggled to acquire the required data from the API. Because each API call gives the data of newly minted NFT’s with no sales. Then I modified the API URL in such a way that for each call it gives the data of NFT’s that are recently sold.
In[]:=
newdata[]:=Sort@(Dataset@ Flatten@Values@Import["https://api.opensea.io/api/v1/events?event_type=successful&only_opensea=false&offset=0&limit=100","RawJSON"]) [All,{"collection_slug","total_price","created_date"}]
All the data that was collected is converted into a dataset.
Joining the pieces of work
Joining the pieces of work
In[]:=
Dataset of tokens and their prices
Dataset of tokens and their prices
Since the data is being imported from the API. It contains information about lots of aspects. Once all the data was together, I was able to take certain parts of the original data of NFT's.
Extract the data of collection_slug , total_price , created_date from the dataset:
In[]:=
data=newdata[];
Below I removed the data that isn't required for the project . The functions newevents and newtransactions filters the dataset in such a way it gives only the data of the NFT's unique ID, Price and Transaction details.
Function to get the data of collection_slug , total_price :
In[]:=
newevents[data_]:=data[All,{"collection_slug","total_price"}]
Function to get the data of transactions:
In[]:=
newtransactions[data_]:=data[All,{"created_date"}]
In[]:=
Count the Number of tokens per each collection
Count the Number of tokens per each collection
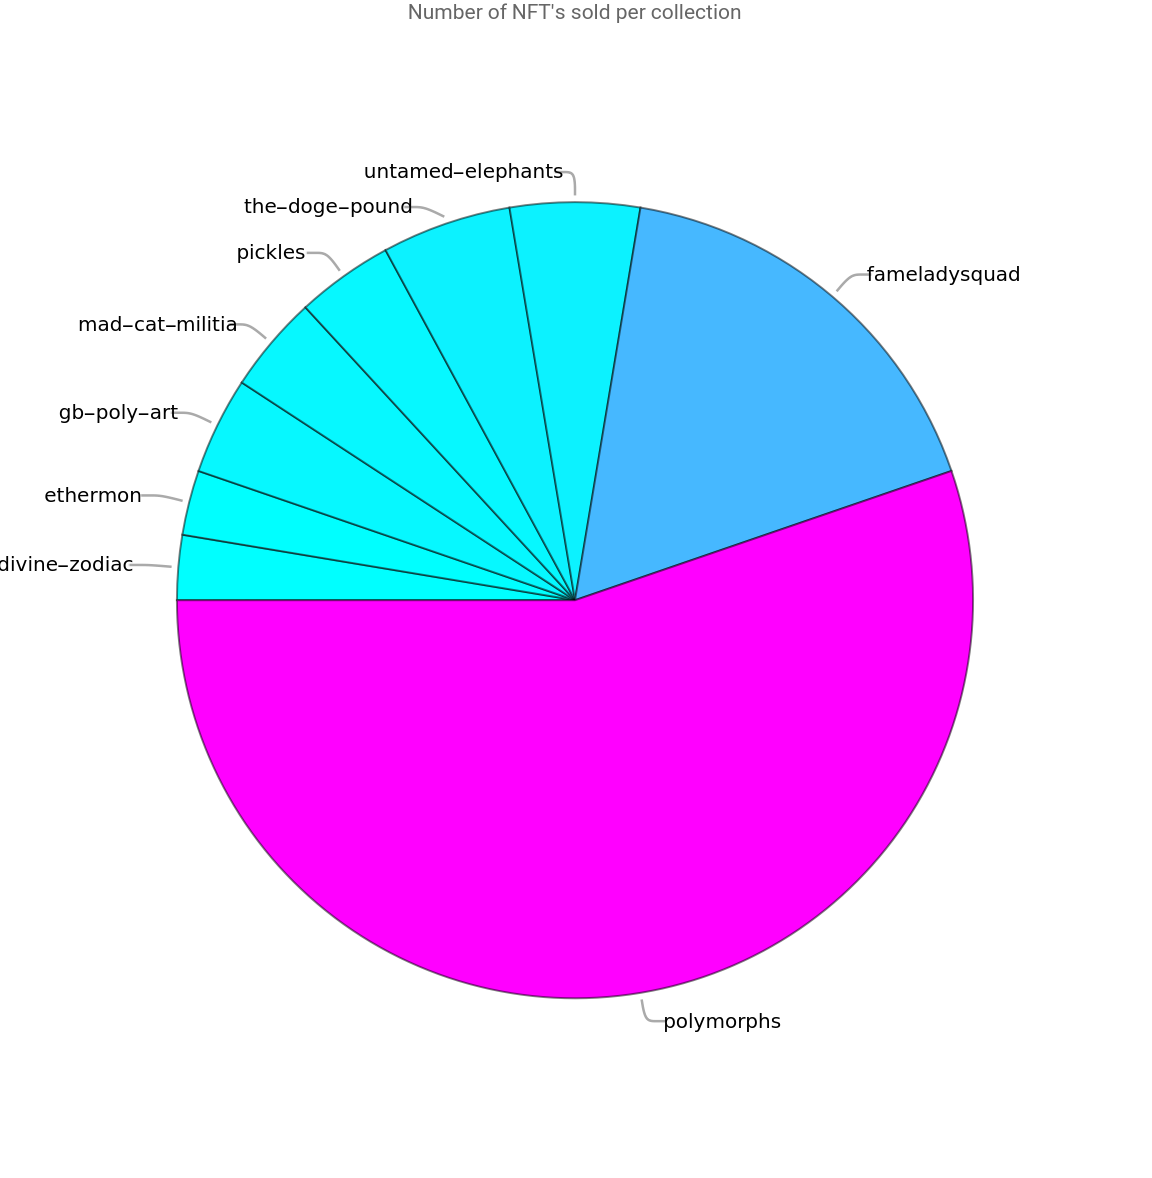
The first thing I wanted to find is how many tokens belong to a collection. Now we need a function to get the count of NFT's from similar collection and covert it into an association for the future use.
Function to make an association to give token count per collection:
In[]:=
newcollectioncount[data_]:=Counts[newevents[data][[All,1]]]//Normal
The newcollectioncount reads the data of newevents and then counts all the NFT's from a similar collection.
In[]:=
PieChart
PieChart
Make a PieChart to show number of NFT's sold per collection.
In[]:=
newcolor[z_]:=RGBColor[z,1-z,1]newpiechart[data_]:=PieChartSort@Select[newcollectioncount[data], # > 1 &],newpiechart[data]
Out[]=
In[]:=
Performing operations on sub groups of data
Performing operations on sub groups of data
Up to this point we've created and collapsed data from an API call. Now, we need to group the data according to their collections and make them into lists.
In[]:=
newcollectiontype[data_]:=GatherBy[newcollectionprice[data],First]
By using First with GatherBy the data is grouped by the first element of each data point.
Make the data in string format to list and convert the prices into ETH:
In[]:=
newcollectiontype1[data_]:=Table[{x[[1,1]],N[Total[ToExpression[x[[All,-1]]]]]/10^18},{x,newcollectiontype[data]}]
I personally love this function(newcollectiontype1). Because, It computes the total price of each collection and then converts the price of NFT's into ETH.
In[]:=
BarChart
BarChart
In[]:=
newbarchart[data_]:=BarChartSelect[newcollectiontype1[data],#[[2]]>0.1&][[All,2]],newbarchart[data]
Out[]=
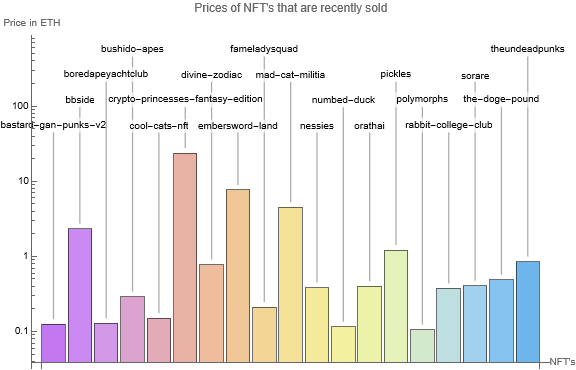
The BarChart above uses the information of newcollectiontype1 to infer the prices of NFT's sold over time. I had to filter and remove few tokens to make the graph. There are tokens which are transferred from one account to another. So their prices are shown as zero.
Extracting the transaction data
Extracting the transaction data
To make a list line plot showing the transactions, we need the dataset containing the list of transactions and time when the transactions occurred.
Function to give the data of transactions:
In[]:=
newtransactionsdata[data_]:=newtransactions[data][All,"created_date"]
The above function gives the data of transaction time in the format yyyy-mm-dd-T-hh-mm-ss. So to make a plot that shows the transactions occurred in a particular interval of time, I need to change the format of data.
Make a function to convert the newtransactiondata into required format:
In[]:=
newminutes[data_]:=(DateList[#][[5]])&/@newtransactiondate[data]newdistinctminutes[minutes_List]:=Module[{list=Cases[minutes,#]&/@DeleteDuplicates[minutes]},Table[list[[n]]//.list[[n]][[1]]->n,{n,Length[list]}]//Flatten]newminlist[data_]:=newdistinctminutes[newminutes[data]]newmins1[data_]:=Counts[newminlist[data][[All]]]newminlab[data_]:=Values[newmins1[data]]
Make a list line plot showing transactions:
The transaction plot shows the number of transactions occurred in 10 minutes for each minute . The newtransactionplot gets the details of transactions from newtransactiondata . The transaction data is gone through various stages such as converting the format, counting the number of transactions happened, concluding the time of transaction .
In[]:=
Leaderboard
Leaderboard
Make a leaderboard of recent NFT's according to prices at which they are sold:
In[]:=
BarChart showing MarketCap of NFT collections.
BarChart showing MarketCap of NFT collections.
This BarChart shows the the market cap's of some of the top NFT's. From the below BarChart we can understand that CyberPunks is one of the top NFT's and no other NFT is not even close to it.
Setting up the dashboard
Setting up the dashboard
Now we have all the visualizations that we need for making a dashboard. The next step is to make a dashboard that is visually pleasing.
As I have visuals of different plots and a leaderboard. I need to set them in such a way everything is perfectly aligned and can fit in a page. The function newgrid makes a grid of all the plots and the function newdashboard takes the grid of plots and combine it with the leaderboard. The newdashboard function also adds the title and information about the dashboard.
Finishing and Deploying to Cloud
Finishing and Deploying to Cloud
In[]:=
Function to run the whole notebook
Function to run the whole notebook
Create a function that runs the whole notebook:
To make a Live dashboard, the data needs to get updated very frequently. So I made a function to evaluate my whole notebook so the API takes a new call and updates the data. If the data changes the visualizations need to be changed to. Every time I run the function it gives a dashboard with new data and visuals.
In[]:=
Cloud Deploying the Dashboard
Cloud Deploying the Dashboard
The final step of the project is to deploy our dashboard into the cloud.
Cloud deploy the dashboard:
Conclusion
Conclusion
NFTs have been created to supply a new use case for the blockchain, and it was pretty successful at that. Now that the NFT market is booming, it is now being seen as a more viable alternative for content creators, artists, gamers, collectors, and other stakeholders, to digitize their assets. It has benefits for every participant in any industry’s supply chain, be it in music, entertainment, arts, or games.
In[]:=
Limitations
Limitations
◼
Significant amount of time is spent on tackling the limitations with the required data.
◼
There are few NFT collections which accepts not only ETH but also different cryptocurrencies. In my project conversion can only be done to ETH.
Future
Future
In[]:=
Extensions
Extensions
◼
A useful extension of this project would be developing a Machine Learning model to predict the price based on NFT image composition and it's traits.
◼
I also want to find the relationship between the NFT market and Bitcoin and Ethereum
Keywords
Keywords
◼
NFT
◼
Block Chain
◼
Ethereum
◼
Live Dashboard
◼
Wolfram Language