Single-Component P-V and T-V Diagrams
Single-Component P-V and T-V Diagrams
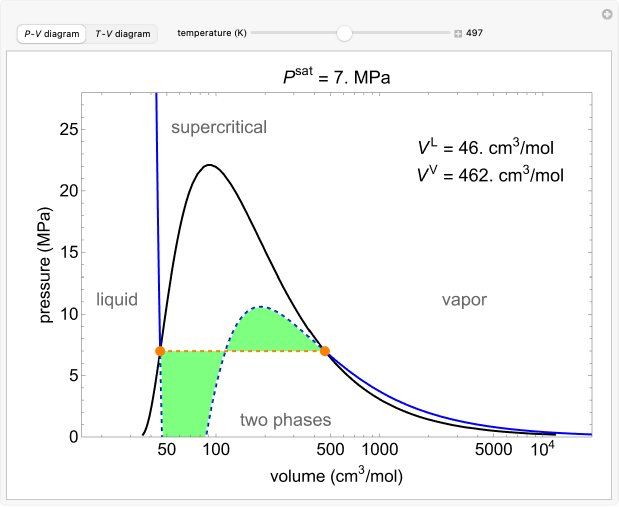
The van der Waals equation of state for water is used to generate isotherms on a pressure-log volume () diagram and isobars on a temperature-log volume () diagram. Use sliders to change the isotherm temperature on the diagram and the isobar pressure on the diagram. Liquid and vapor are in equilibrium within the phase envelope, which is generated from data for water. The isotherms and isobars have three solutions in the two-phase region, but the only physically-meaningful conditions are the orange dots, which correspond to saturated liquid and saturated vapor. The saturated liquid volume and the saturated vapor volume are displayed. The horizontal, dashed orange line (at and ) represents a mixture of liquid and gas. On the diagram, the green area above the orange line is equal to the area below the orange line when plotted on a linear volume scale.
P-V
T-V
P-V
T-V
L
V
V
V
sat
P
sat
T
P-V
Details
Details
Isotherms and isobars are solved using the Van der Waals equation of state:
P=-
RT
V-b
a
2
V
rearranged:
T=P+(V-b)
1
R
a
2
V
a=
27
64
2
R
2
T
c
P
c
b=
R
T
c
8
P
c
where is pressure (MPa), is the ideal gas constant (), is temperature (K), is molar volume (/mol), and are van der Waals constants, is the critical temperature of water (K), and is the critical pressure (MPa).
P
R
[MPa]/[molK]
3
cm
T
V
3
cm
a
b
T
c
P
c
The screencast video at[1] explains how to use this Demonstration.
References
References
[1] Single-Component P-V and T-V Diagrams. www.colorado.edu/learncheme/thermodynamics/SingleComponentPVTVdiagrams.html.
External Links
External Links
Permanent Citation
Permanent Citation
Rachael L. Baumann, John L. Falconer
"Single-Component P-V and T-V Diagrams"
http://demonstrations.wolfram.com/SingleComponentPVAndTVDiagrams/
Wolfram Demonstrations Project
Published: September 16, 2014