Introduction
Introduction
This post will be about the Wolfram Data Repository resource containing genetic sequences of the SARS-CoV-2 virus.
In[]:=
ResourceObject["Genetic Sequences for the SARS-CoV-2 Coronavirus"]

Where is this data from?
Where is this data from?
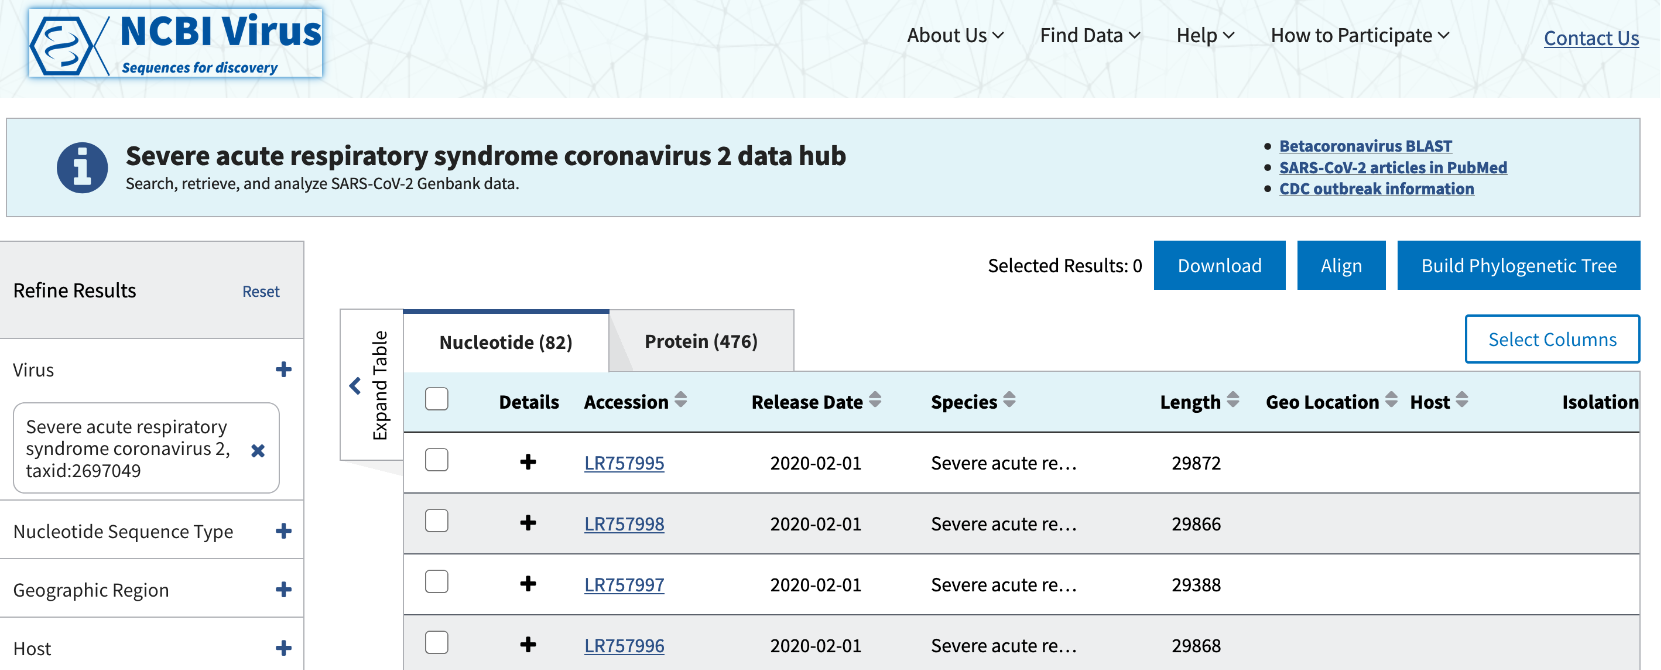
This data is provided by the National Center for Biotechnology Information's Severe acute respiratory syndrome coronavirus 2 data hub:
What data is contained in this resource?
What data is contained in this resource?
This data provides a Dataset of genetic sequences of the virus along with metadata providing context about those sequences:
In[]:=
ResourceData["Genetic Sequences for the SARS-CoV-2 Coronavirus"]
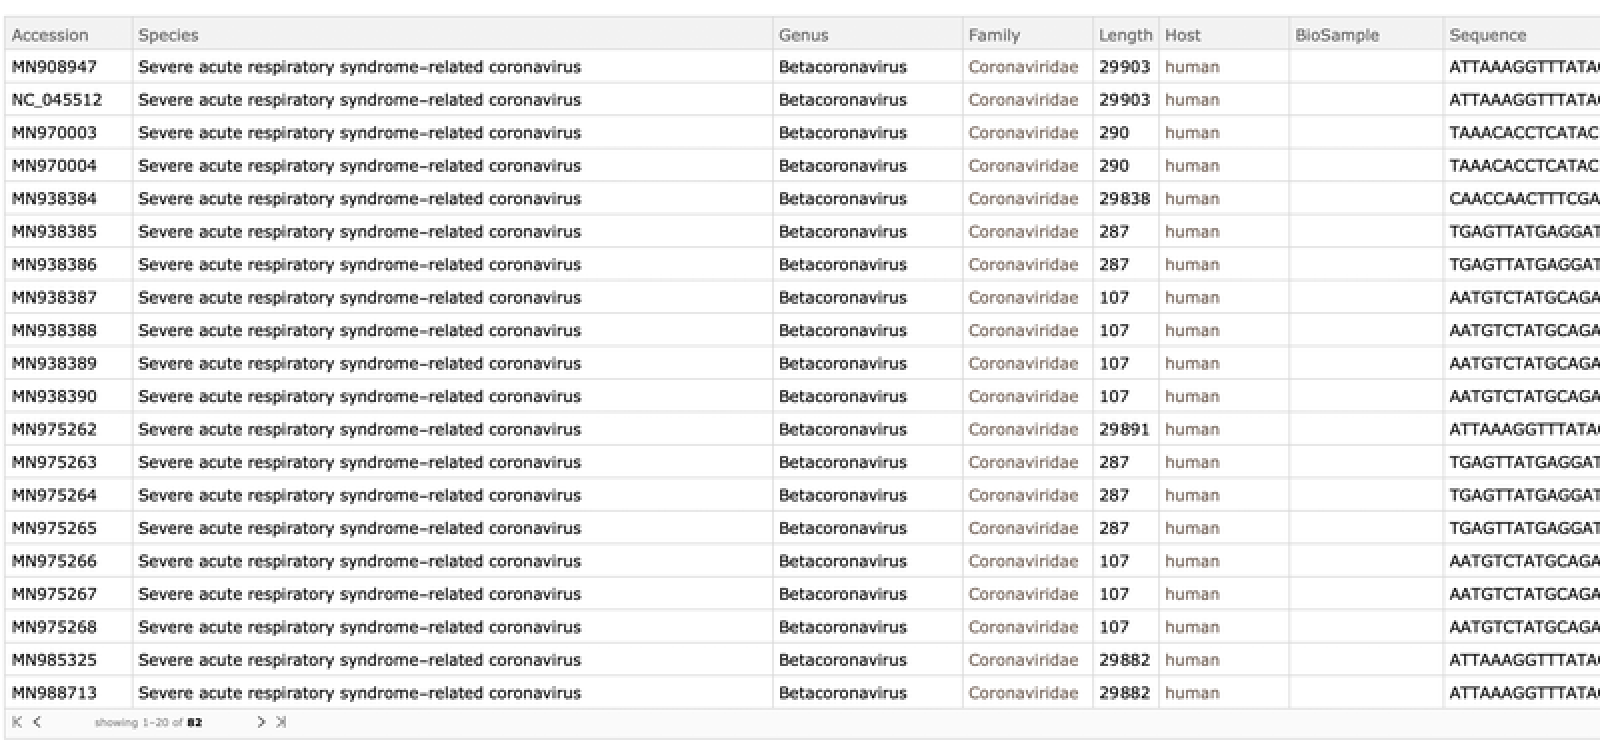
This metadata includes the location the genetic sample was acquired from, the collection and release dates, biological descriptions of sequence itself, and other metadata. Note that the “Country” column may be phased-out in future releases:
In[]:=
Keys@*First@*Normal@ResourceData["Genetic Sequences for the SARS-CoV-2 Coronavirus"]
Out[]=
{Accession,Species,Genus,Family,Length,Host,BioSample,Sequence,CollectionDate,ReleaseDate,GeographicLocation,NucleotideStatus,GenBankTitle,IsolationSource,Country}
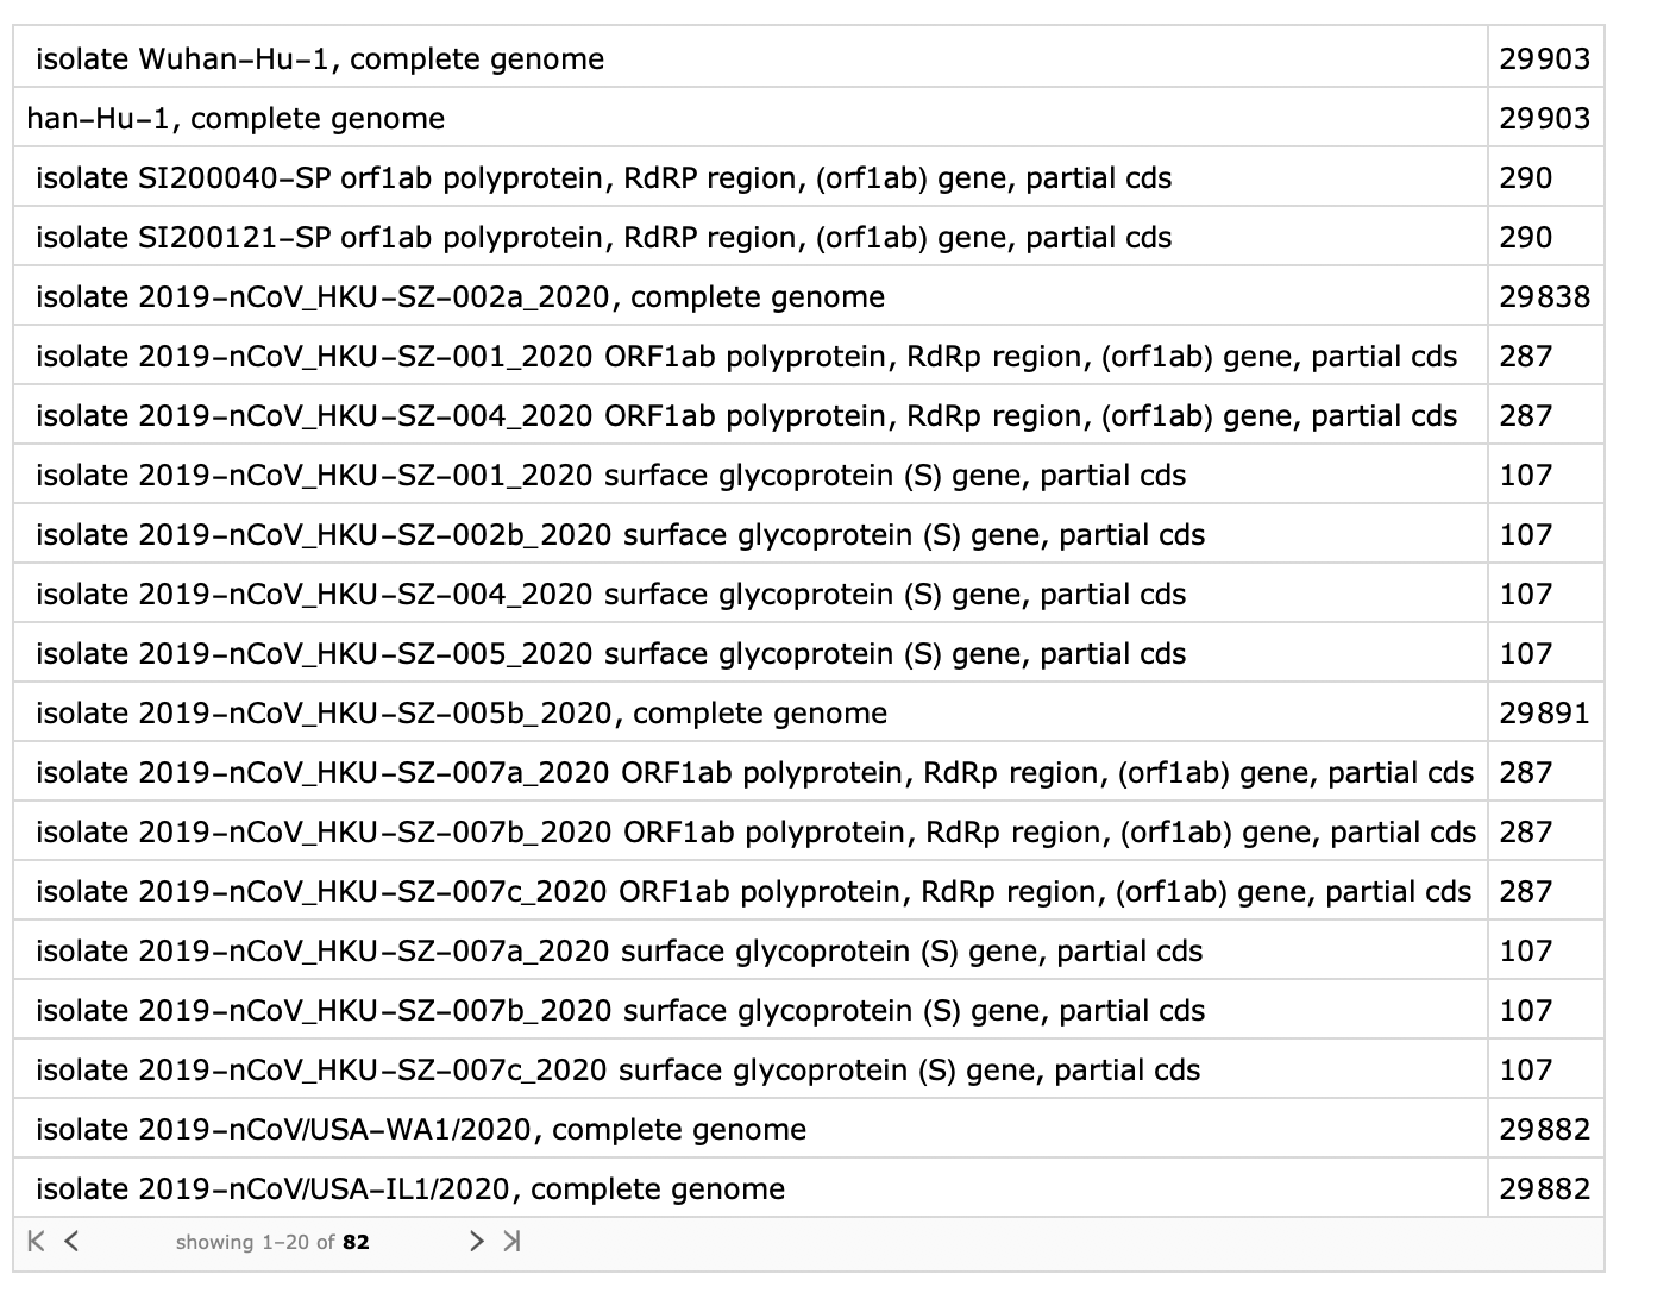
These sequences include both complete genomes and particular regions of the virus:
In[]:=
ResourceData["Genetic Sequences for the SARS-CoV-2 Coronavirus"][All,{"GenBankTitle","Length"}][All,{StringDrop[#["GenBankTitle"],StringLength["Severe acute respiratory syndrome coronavirus 2"]]&,"Length"}]
What analysis is provided as part of this resource?
What analysis is provided as part of this resource?
Additional Elements
Additional Elements
Get a timeline plot of collection dates:
In[]:=
ResourceData["Genetic Sequences for the SARS-CoV-2 Coronavirus","CollectionTimeline"]
Out[]=

Contents cannot be rendered at this time; please try again later or download this notebook for full functionality »
See a timeline plot of release dates:
In[]:=
ResourceData["Genetic Sequences for the SARS-CoV-2 Coronavirus","ReleaseTimeline"]
Out[]=
Contents cannot be rendered at this time; please try again later or download this notebook for full functionality »
In[]:=
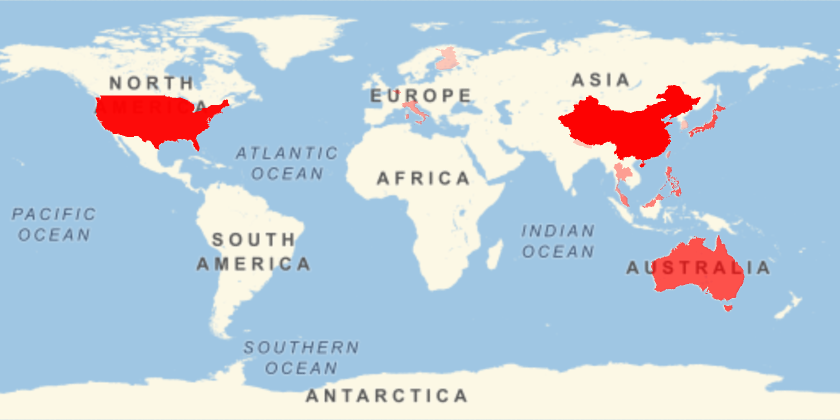
ResourceData["Genetic Sequences for the SARS-CoV-2 Coronavirus","AffectedLocations"]
Out[]=
Visualization
Visualization
A phylogenetic tree comparison of complete genomes implies that while blocks of occurrences in China, the United States, and Japan are very similar, later occurrences are diverging as the virus spreads and mutates. Dropping the trailing sequences of adenine terms avoids arbitrary differences from varying poly(A) RNA tail lengths, which may be sequencing artifacts and shouldn’t affect viral adaptivity:
In[]:=
dropTrailingA[seq_]:=StringReplace[seq,StartOfString~~Shortest[a__]~~("A"..)~~EndOfStringa];Apply[ResourceFunction["PhylogeneticTreePlot"],Transpose[{dropTrailingA@First[#],Row@(Rest@#)}&/@(Values/@Normal[ResourceData["Genetic Sequences for the SARS-CoV-2 Coronavirus"][Select[StringContainsQ[#GenBankTitle,"complete genome"]&],{"Sequence","GeographicLocation","CollectionDate"}]])]]
Analysis
Analysis
Observations of the content of different mutations by geographic location suggest that China has seen the most viral evolution, but each location has their unique strains:
How else might I analyze the data in this resource?
How else might I analyze the data in this resource?
Apply an analysis similar to the above to virus fragments of the same type.
Use sequence alignment to uncover specific mutations and compare them over time to verify the viral lineages produced from the phylogenetic trees provided.
Calculate the difference between collection and release date by geographic location.
Classify which terms will be in the GenBank label based upon the sequence.
Compare sample and mutation counts to location populations.
...
How might I use this data in conjunction with other data I might have?
How might I use this data in conjunction with other data I might have?
Cross Virus Comparison
Cross Virus Comparison
If you have the sequences of other viruses, you might compare how similar they are to the viral samples here.
Gathering Data
Gathering Data
Here is an example using the original reference sequence from above:
We will also use another complete sequence from the provided dataset, which I have chosen arbitrarily:
Access a sequence for a SARS-like virus that occurs in bats:
Similarly, access the reference SARS sequence for humans:
Similarity Comparison
Similarity Comparison
First, we’ll define a normalized similarity function so that similarities of sequences of different lengths are treated identically:
Alignment Visualization
Alignment Visualization
First, we’ll obtain the sequence alignments for each sequence with the original reference SARS-CoV-2 sample:
We can see that there are many fewer differences among SARS-CoV-2 sequences than with bat SARS:
If the alignment matches (and is a string, we’ll add the length), otherwise we’ll subtract the length of the mismatch:
We can create a set of coordinates with the slope determined by alignment similarity:
Using these functions, we can plot the similarity of different alignments in comparison with each other: