When foraging for mushrooms in nature, it is essential to distinguish which mushrooms are edible and which aren’t. It can mean the difference between life and death. The aim of my project will be to see if it is possible to accurately predict whether a mushroom is poisonous or edible based on only 5 key features/variables. I will utilize a dataset I found with 22 features of mushrooms such as habitat, cap color, odor, etc. and see what the most common features found in lots of poisonous mushrooms are.
The dataset is originally from UCI Machine Learning, however it was uploaded to Kaggle: https://www.kaggle.com/datasets/uciml/mushroom-classification
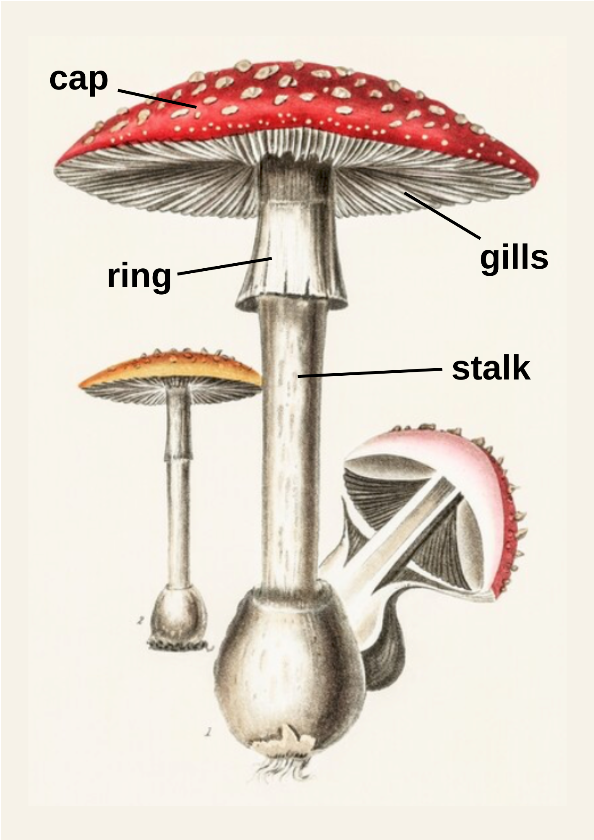
Here is an image below of some of the features of a mushroom, one may not be familiar with:
Here is an image below of some of the features of a mushroom, one may not be familiar with:
Import Dataset
Import Dataset
After importing, I had to clean the data as well by deleting any rows with missing data
In[]:=
data=Import[NotebookDirectory[]<>"mushrooms.csv","Dataset","HeaderLines"1]data=DeleteMissing[data,1,2];
Out[]=


Build Classification Model
Build Classification Model
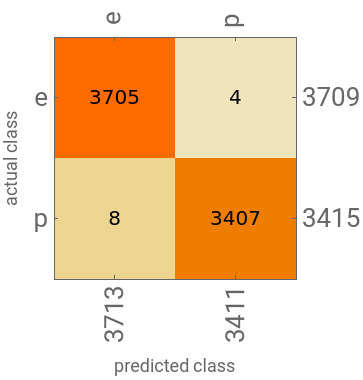
Using training and test data, I was able to find the accuracy of the data with all 22 variables in its ability to predict whether a mushroom was poisonous. It was wrong around 0.2% of the time.
In[]:=
(*https://reference.wolfram.com/language/tutorial/NeuralNetworksClassification.html*){trainingData,testData}=TakeDrop[RandomSample[data],1000];cf=Classify[trainingData"class",Method"LogisticRegression"];ClassifierMeasurements[cf,testData"class","Accuracy"]ClassifierMeasurements[cf,testData"class","ConfusionMatrixPlot"]ClassifierMeasurements[cf,testData"class","FalseNegativeRate"]
Out[]=
0.998316
Out[]=
Out[]=
e0.00107846,p0.00234261
In[]:=
testData[[2]][[2;;]]
Out[]=
Example of Checking Variable Importance
Example of Checking Variable Importance
Counting amount of samples falling in under different values of “cap-color” for edible and poisonous, which the bar chart below will be based on. First table represents the different cap-colors of edible mushrooms, while the second table displays the different cap-colors of poisonous mushrooms.
In[]:=
f1=Counts[data[Select[#class"e"&],"cap-color"]]f2=Counts[data[Select[#class"p"&],"cap-color"]]
Out[]=
Out[]=
Graphing Individual Variables
Graphing Individual Variables
Creating bar charts for each variable (cap-shape, cap-surface, cap-color, etc.), where the key is that white represents edible and red represents poisonous.
Computing and Ranking Variable Importance for All Variables
Computing and Ranking Variable Importance for All Variables
Even though, some of the large differences in each variable may be visible above, now a computation will also calculate at the absolute value difference between the edible and poisonous mushroom variables to find the most striking differences.
Here is the final ranking looking at the largest differences in variables of edible vs poisonous mushrooms (based on the absolute value differences computed above)
Classification Model for Top 5 Variables
Classification Model for Top 5 Variables
Using top 5 predictably most important individual variables/factors to determine whether mushroom is poisonous or edible
Top 5 variables compared to all variables gave equal accuracy in determining whether a mushroom is poisonous (false negative rates of around 0.1-0.4%) when having a training set of 1000
Classification Model for Last 5 Variables
Classification Model for Last 5 Variables
Last 5 variables in ranking compared to all variables gave a very weak rate of accuracy in determining whether a mushroom is poisonous (false negative rates of around 50-55%) when having a training set of 1000
Interpretation
Interpretation
Did I achieve main goal: Yes, I was able to accurately predict whether a mushroom is poisonous or edible based on only 5 key features/variables
The 5 main features to look at are:
1. Odor
2. Spore Print Color
3. Gill Color
4. Ring Type
5. Stalk Surface Below Ring
Also, the technique utilized was successful as using only the first 5 features on the ranking list was clearly a lot more accurate then only the last 5. There was a large difference in variable importance.
Overall, these 5 main features can be used by mushroom foragers or gatherers to quickly determine whether a mushroom is poisonous or edible.
Another Approach to identify “important” features:
Another Approach to identify “important” features:
Shapley value (SHAP Values)
CITE THIS NOTEBOOK
CITE THIS NOTEBOOK
Predicting whether a mushroom is poisonous or edible using five variables
by Zoe Horvath
Wolfram Community, STAFF PICKS, July 5, 2023
https://community.wolfram.com/groups/-/m/t/2952324
by Zoe Horvath
Wolfram Community, STAFF PICKS, July 5, 2023
https://community.wolfram.com/groups/-/m/t/2952324