Charting with BarChart
Charting with BarChart

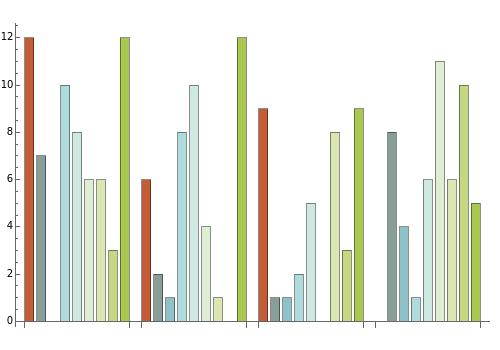
Mathematica's symbolic architecture and dynamic interface makes possible a uniquely flexible and convenient approach to charting. This Demonstration illustrates the new incredible possibilities of BarChart in Mathematica 7.
External Links
External Links
Permanent Citation
Permanent Citation
Bernard Vuilleumier
"Charting with BarChart"
http://demonstrations.wolfram.com/ChartingWithBarChart/
Wolfram Demonstrations Project
Published: March 7, 2011