Alpha helices are essential structural building blocks in proteins. Mutations within these helices can lead to significant structural and geometrical changes, often contributing to disease. While amino acid propensities for alpha - helix formation and the general effects of common mutations have been extensively studied, a computational approach focused purely on the detailed geometrical consequences of amino acid substitutions to the alpha helix structure remain limited. In this project, methods for quantifying geometrical changes, including changes in bond lengths, atom distances, torsion angle, and helix radius are applied to model alpha helices of 15 amino acids in length, using the most common residues. Analyzing how much a mutation distorts the helix gives more precise, actionable insights allowing for a deeper understanding of certain genetic diseases as well as drug therapies that target alpha helices.
Introduction
Introduction
An alpha helix is a coiled structure that makes up proteins where the carbonyl oxygen of residue “i” forms a hydrogen bond with the amide hydrogen of residue “i+4” causing it to coil with exactly 3.6 residues per turn and a pitch of 5.4 Å. The average globular protein contains 30% alpha-helix making it the most common type of secondary structure (C. Nick Pace & J. Martin Scholtz 1998). Due to their fundamental role in proteins the presence of a mutation can lead to a variety of diseases including dilated cardiomyopathy, Parkinson’s disease, amyotrophic lateral sclerosis (ALS), and prion diseases.
Although amino acid helix propensities and overall thermodynamic stability have been extensively studied through statistical analyses and experimental peptide studies, detailed computational investigations focused specifically on the three-dimensional geometric effects of mutations remain relatively limited. Most prior work has emphasized whether a helix forms or its overall stability rather than quantifying how specific substitutions distort its atomic-level geometry.
Although amino acid helix propensities and overall thermodynamic stability have been extensively studied through statistical analyses and experimental peptide studies, detailed computational investigations focused specifically on the three-dimensional geometric effects of mutations remain relatively limited. Most prior work has emphasized whether a helix forms or its overall stability rather than quantifying how specific substitutions distort its atomic-level geometry.
This project aims to systematically introduce mutations into a control poly-alanine alpha helix and quantitatively analyze the geometrical changes, including bond length, atom distance, torsion angle, and helix radius, that these mutations cause to the alpha helix. Through this analysis, a deeper understanding of the connection between changes in amino acid identity and the resulting effect on alpha helix structure can be gained, which may be useful for targeting diseases involving mutated alpha helices or for designing therapeutic alpha helices.
The control alpha helix: poly-alanine
The control alpha helix: poly-alanine
To begin, a control alpha helix was needed to serve as the baseline for comparing all mutations. Poly-alanine, a homopolymer made of 15 alanine amino acids bonded by peptide bonds, was selected for this purpose. Poly-alanine was chosen due to its extremely stable structure, as it is known to form “perfect” alpha helices. This is because alanine has a very simple, non-reactive side chain (a single methyl group), which prevents it from engaging in complex side reactions.
To make polyAlanine as well as to make the systematic mutation as we go forward, function foldProtein was made which takes a list and uses ESMFold to create a peptide molecule with chemically accurately placed atoms. The list can be a string, which is easy to manipulate systematically, which will allow be to generate many mutated peptide strands.
To make polyAlanine as well as to make the systematic mutation as we go forward, function foldProtein was made which takes a list and uses ESMFold to create a peptide molecule with chemically accurately placed atoms. The list can be a string, which is easy to manipulate systematically, which will allow be to generate many mutated peptide strands.
Uses ESMFold to covert a string into a folded peptide
In[]:=
ClearAll@foldProtein;foldProtein[seq_]:=BioMolecule[BioSequence["Peptide",StringJoin@seq],BioMoleculeFoldingMethod->"ESMFold"]
ConstantArray makes a list of 15 “A”s
In[]:=
polyala=foldProtein[ConstantArray["A",15]];
In[]:=
BioMoleculePlot3D[polyala]
Out[]=

In[]:=
mol=Molecule[polyala];
To apply systematic sets of mutations I chose certain relevant amino acids to work with. I classified them into groups based on their propensity. Propensity of an amino acid in alpha helix is a measure of how willing an amino acid is to form an alpha helix.
Group 1: Helix Formers & Stabilizers: Alanine, Methionine,Glutamate, Lysine
Group 2: Helix Indifferent: Valine, Isoleucine, Phenylalanine, Tyrosine, Tryptophan
Group 3: Helix Breakers: Proline, Glycine, Asparagine
Group 2: Helix Indifferent: Valine, Isoleucine, Phenylalanine, Tyrosine, Tryptophan
Group 3: Helix Breakers: Proline, Glycine, Asparagine
Table code
Table code
headers={"Amino Acid","Structure","Propensity Value"};group1=;group2=;group3=;headerBorder=GrayLevel[0.4];group1Border=RGBColor[0.1,0.55,0.1];group2Border=RGBColor[0.75,0.45,0.0];group3Border=RGBColor[0.8,0.1,0.1];styledHeaders=Map[Item[#,Frame->True,FrameStyle->headerBorder]&,headers];styledGroup1=Map[Item[#,Frame->True,FrameStyle->group1Border]&,group1,{2}];styledGroup2=Map[Item[#,Frame->True,FrameStyle->group2Border]&,group2,{2}];styledGroup3=Map[Item[#,Frame->True,FrameStyle->group3Border]&,group3,{2}];comprehensiveTableData=Join[{styledHeaders},styledGroup1,styledGroup2,styledGroup3];GridcomprehensiveTableData,
Out[]=
Amino Acid | Structure | Propensity Value |
Alanine (A) | Molecule | 1.42 |
Methionine (M) | Molecule | 1.45 |
Glutamate (E) | Molecule | 1.51 |
Lysine (K) | Molecule | 1.16 |
Valine (V) | Molecule | 1.06 |
Isoleucine (I) | Molecule | 1.08 |
Phenylalanine (F) | Molecule | 1.13 |
Tyrosine (Y) | Molecule | 0.69 |
Tryptophan (W) | Molecule | 1.08 |
Proline (P) | Molecule | 0.57 |
Glycine (G) | Molecule | 0.57 |
Asparagine (N) | Molecule | 0.67 |


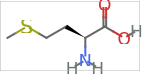
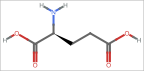
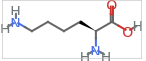


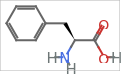
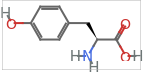

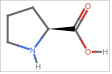
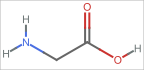
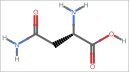
Changing propensity of amino acids
Changing propensity of amino acids
Amino acid propensity is the statistical likelihood that a specific amino acid will adopt a particular secondary structure. To examine the intrinsic ability of individual amino acids to form and stabilize helical structures I generated 15-residue homo-polymers ( sequences composed entirely of a single amino acid type ) of each selected amino acid. This controlled approach isolates the contribution of each side chain to helix geometry, free from interactions with neighboring residues. Although propensity scales exist, this approach allows us to quantify the geometric consequences that underlie those propensities.
Takes a single letter and using foldProtien and ConstantArray, turns it into a molecule peptide of length 15
In[]:=
ClearAll@makeHomoPolymer15;makeHomoPolymer15[x_]:=Molecule[foldProtein[ConstantArray[x,15]]]
In[]:=
aminoAcids={"A","M","E","K","V","I","F","P","G"};
Applies makeHomoPolymer to aminoAcids
In[]:=
makeHomoPolymer15[#]&/@aminoAcids;
Distance between nitrogen and oxygen atoms
Distance between nitrogen and oxygen atoms
Hydrogen bonds that form between the “i” O-C and the “i+4” N-H hold the helix together. The distance between the amide nitrogen (N) of residue i+4 and the carbonyl oxygen (O) of residue i that form a hydrogen bond. In a stable alpha helix this is 2.8–3.0 Å (Baker & Hubbard, 1984). A deviation from this number would allow us to understand weather the alpha helix is stretching out or becoming most tightly coiled and by what extent.
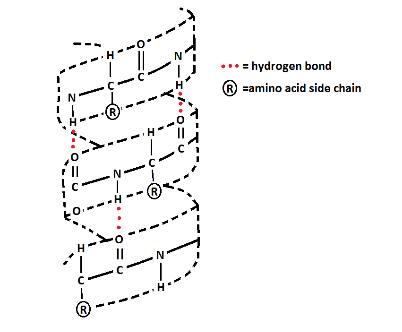
Hydrogen bonding in an alpha helix
In order to calculate the distance of between every N and O first the coordinates of N and O are found. To find the coordinates first AtomicSymbol is used to find the index number of the atoms of that element (Nitrogen and Oxygen respectively). Then the atom coordinates are found and the coordinates at the found index numbers are extracted. Finally the distance between the ith Oxygen and the i+4 th Nitrogen are found using EuclideanDistance which give the straight-line distance between two points
Finds the position of atoms with atomic symbol “N” and “O” respectively, then finds the coordinates at these positions. Finally EuclideanDistance is used to calculate the distance between the coordinates of O i and N i+4.11
In[]:=
ClearAll[nToOBondDistances];nToOBondDistances[x_]:=Table[EuclideanDistance[QuantityMagnitude[MoleculeValue[x,"AtomCoordinates"]][[Flatten[Position[MoleculeValue[x,"AtomicSymbol"],"O"]]]][[1;;15]][[i]],QuantityMagnitude[MoleculeValue[x,"AtomCoordinates"]][[Flatten[Position[MoleculeValue[x,"AtomicSymbol"],"N"]]]][[i+4]]],{i,1,11}]
Applies the function to the control PolyAlanine to give distances between O and N which are around the value 3.0 A
In[]:=
nToOBondDistances[Molecule[polyala]]
Out[]=
{2.54838,2.819,2.98462,3.18553,3.24028,3.26043,3.33155,3.1544,3.14635,3.36553,3.30494}
Nitrogen to oxygen distance in homo-polymers
Nitrogen to oxygen distance in homo-polymers
Then, to achieve the goal of comparing hydrogen bond distance between homo-polymer helices of different amino acids, I mapped nToOBondDistances onto homo-polymers of all the amino acids and then found the mean for each to allow for simpler comparison.
In[]:=
distances=nToOBondDistances[makeHomoPolymer15[#]]&/@aminoAcids;
In[]:=
means=Mean/@distances
Out[]=
{3.12191,2.88295,12.1289,7.43774,3.11163,3.01759,2.91877,9.39463,9.47352}
Distance between nitrogen and oxygen atoms in homo-polymers
The results show Alanine (A), Methionine (M), Valine (V), Isoleucine (I), and Phenylalanine (F) exhibit mean N–O distances close to the ideal range (approximately 2.9–3.1 Å), indicating stable a- helical conformations with intact hydrogen bonding networks . In contrast, Glutamate (E), Lysine (K), Proline (P), and Glycine (G) display substantially larger distances, ranging from 7.4 Å to over 12 Å .
Larger N–O distances indicate significant disruption of the helical geometry because the alpha helix is primarily stabilized by regular hydrogen bonds between the carbonyl oxygen of residue i and the amide nitrogen of residue i+4. In an ideal α-helix, this distance is approximately 2.8–3.0 Å. When the measured N–O distance becomes substantially larger (e.g., 7 Å or more), the hydrogen bond is weakened or entirely broken. This leads to local unwinding or kinking of the helix, causing the backbone to lose its characteristic coiled conformation and shift toward a more extended or disordered structure.
Although Glutamate (E) and Lysine (K) are in Group 1 and have a high propensity , Glutamate has the largest nitrogen to oxygen distance and Lysine’s nitrogen to oxygen distance is also much larger than 3.1 A. This can be explained by their highly positively charged R-groups. Natural proteins typically surround these charged residues with oppositely charged or neutral amino acids allowing stabilizing interactions such as salt bridges and hence appear frequently in peptide chains making them have a high propensity value. In contrast, in a homo-polymer, they repel each other due to strong electrostatic repulsion hence the huge distance created between N and O. This contrast highlights that helix propensity is context-dependent, and controlled homo-polymer models can reveal geometric behaviors that are masked in more complex protein environments.
Alpha carbon - alpha carbon distance
Alpha carbon - alpha carbon distance
To further compare the different homo-polymers the the alpha carbon–alpha carbon (Cα–Cα) distance was analyzed. This measures the straight-line (Euclidean) distance in 3D space between the alpha carbon atoms of different residues in the peptide chain. In an ideal alpha helix, consecutive alpha carbons are approximately 3.8 Å apart, and the overall pattern of distances across the helix is highly regular due to the consistent 3.6 residues per turn geometry.
Similar to how nitrogen to oxygen distance was calculated, first the index numbers of the alpha carbons was needed to pull out the coordinates of those specific atoms. However, in peptides there are carbonyl carbons as well as alpha carbons so AtomicSymbol cannot be used as that would pull out all carbons when we only want alpha carbons. So instead the MoleculeValue property “AtomChirality” was used. The alpha carbons are chiral (bonded to four different atoms). Then the coordinates at these index numbers were taken out. Finally, DistanceMatrix was used to give a matrix of distances which calculates how far every alpha carbon is from any other alpha carbon.
The property from MoleculeValue “AtomChirality” was used to grab the index numbers of alpha carbons in the molecule. Matrix plot creates visually represents these distances.
This temperature map shows a clear smooth gradient indicating that the amino acids are alpha carbons are arranged in a very regular, repeating spiral. Because the distance between two alpha carbons is directly proportional to the difference between their residue numbers, the plot appears smooth. This shows us once again that poly-alanine has a highly regular and repetitive structure, proving that it is an alpha helix.
Alpha carbon distance in homo-polymers
Alpha carbon distance in homo-polymers
To assess the structure of the other homo-polymers made of amino acids with different propensity the same function is applied to compare the Matrix Plot.
Group 1 amino acid : alanine
Group 1 amino acid : alanine
A homo-polymer of alanine (a group 1 amino acid) is folded and then alpha carbon-alpha carbon distance is plotted
Group 3 amino acid : proline
Group 3 amino acid : proline
The same process is repeated for group 3 amino acid proline and asparagine
Group 3 amino acid : asparagine
Group 3 amino acid : asparagine
The matrix plots provide a clear insight into the distortion in structure in group 3. There is a lack of clear gradient. The darkest color in the proline plot is between the first and eleventh alpha carbon as well as the twelfth and eleventh alpha carbons. This shows that the difference in residue number of two alpha carbons and the distance between two alpha carbons is not proportional. This indicates some sort or irregular structure such as a kink. The group 3 plot appears to be similar but is not the same if observed carefully.Proline plot has a slightly smooth gradient going out from the darkest red, how ever asparagine lacks this.
Single substitution mutation with different sized amino acids
Single substitution mutation with different sized amino acids
Building upon the homo-polymer analysis, which analyzed the intrinsic helix-forming ability of individual amino acids in isolation, the next phase examines the geometric impact of single amino acid substitutions within a helical context. An amino acid’s R group (variable region) determines the change it will cause when substituted into an alpha helix. To investigate how side-chain size and steric hindrance affect helix stability, different sized amino acids were substituted at the central position (residue 8) of the 15-residue poly-alanine control helix. This approach allows for a direct comparison of how increasing R-group bulk influences key geometric parameters while keeping the rest of the sequence constant. Steric hindrance describes the destabilization and twisting caused by bulky, overlapping amino acid side chains. The presence of a large R group amino acid can immediately distort the structure of the alpha helix.
In order to see a clear relationship between size of R group and the degree of distortion it causes I ordered the chosen amino acids according to the size of their R groups and then substituted them into the 8th residue.
6 of the selected amino acids were ordered from smallest R group to largest R group:
◼
Glycine
◼
Valine
◼
Isoleucine
◼
Methionine
◼
Lysine
◼
Phenylalanine.
Table code 2
Table code 2
Substituting the 8th amino acid to get mutations
Substituting the 8th amino acid to get mutations
First step is to get the mutated strings with the chosen residue substituted in the 8th position. This is then done with all 6 chosen amino acids.
foldProtein function is then mapped onto all the mutated strings to create folded peptide strands with the mutation.
Torsion Angle
Torsion Angle
Steric hinderance affects torsion angle. Torsion angle measures the angle of rotation between the two planes formed by the four main atoms (C,C,N,H ) in a peptide bond. A change in torsion angle indicates a change in carbon backbone structure making it a way to compare how much different mutation affect the carbon backbone.
Find the location of groups of atoms with the given structure using MoleculePattern and then FindMoleculeSubstructure for index number of it to locate it.
Use MoleculeValues’s TorsionAngle property to find the angle between the two planes formed by the 4 atoms ad index numbers are from locatingAminoFunctionalGroup
Applying it on control
Torsion Angle Comparison of Mutated peptides
Torsion Angle Comparison of Mutated peptides
FInds torsion angle for all chose amino acids
The calculated absolute deviations in the first backbone torsion angle demonstrate that the resulting geometric distortion is non-linear relative to side-chain volume alone. The seem to be mainly affected by the properties of the R groups. Highly compatible hydrophobic residues, namely Isoleucine and Methionine, demonstrate minimal structural disruption because their unconstrained side chains cleanly extend outward into solvent space without causing main-chain atomic clashing. Conversely, severe steric hindrance from Phenylalanine’s rigid aromatic ring and Lysine’s extended architecture forces massive, high-energy backbone distortions to relieve local van der Waals strain.
N to O distance Comparison of mutated peptides
N to O distance Comparison of mutated peptides
To compare the single mutation peptides further the nToODistances was used. This provides insight into whether hydrogen bonds have broken or not.
The 5th item in the list has one length 7.42617 which is way above 3.1. This is the poly-alanine substituted with with lysine. This is likely due to the bulky side chain and the charge density.
Then the standard deviation of the mean bond distances is calculated
The standard deviation is very low showing that N-O bond wasn’t majorly affected by the single substitution and the effect of a single mutation gets cancelled out, allowing the alpha helix to mostly stay the same.
Lay over poly(alanine)
Lay over poly(alanine)
To visualize the change in structure caused by a single substitution I used BioMoleculePlot3D.
Aligns the first mutated molecule with the normal molecule
It can be seen in this visualization that before the 8th residue both molecules are in line but after the 8th residue/ on the other side the molecules are further apart and not touching.
Because the N-terminal segments (residues 1–7) remain perfectly coincident with the poly-alanine control, the single altered dihedral angle acts as a spatial hinge. This angular change on residue 8 twists the helical axis, causing the C-terminal to progressively extend in and separate in space despite retaining their internal helical geometry. This demonstrates how a single-point mutation can segment an alpha-helix into autonomous rigid blocks.
For all the mutated polyAlanines
For all the mutated polyAlanines
Residues 1–7 stay fully aligned with the poly-alanine control, showing the mutation at residue 8 doesn’t affect the residues preceding turn. The two structures start separating right at the mutation site, since the altered side chain shifts the local backbone dihedral angles. This shift acts as a hinge meaning that residues 9 onward keep a normal helical geometry but are displaced in space, causing the visible separation toward the C-terminus. This matches the low standard deviation seen in the N–O bond distances: local hydrogen bonding is preserved, but a single substitution can still reorient one helical segment relative to the rest.
The low variability in mean N–O bond distances likely reflects an averaging effect rather than a true absence of local disruption. Because the metric is computed as a mean across the full backbone, a stretched or compressed bond near the mutation site can be offset by unaffected bonds elsewhere in the helix, producing a low overall standard deviation (0.36863) even when local hydrogen bonding is disturbed. In contrast the torsion angle data captures local geometry directly. The small hydrophobic residues (Ile, Met) barely shift the backbone, while bulky or rigid ones (Lys, Phe) cause large deviations to relieve steric clash. Taken together, these results suggest that single substitutions perturb the helix locally at the mutation site and while average hydrogen bonding length stays the same, the direction the helix goes in changes, changing the overall structure.
Substituting glycine in specific percentages
Substituting glycine in specific percentages
As established through propensity scale previously, glycine and proline are both respectively helix breakers. To understand better the relationship between helix deformation and the presence of these helix breakers a systematic mutation approach using these two amino acids is taken.
The goal is to see the relationship between the amount of helix breaker amino acid present and the amount of deformation to the alpha helix. Once again using poly-alanine as the control, I chose increasing percentages of the helix breakers to substitute (12.5, 25, 50, 75, 100). The helix breaker amino acids are placed randomly in the poly alanine but in the given percentage. Five of these randomly mutated peptides are created for all 5 percentages and then the mean nitrogen to oxygen distance is found.
The goal is to see the relationship between the amount of helix breaker amino acid present and the amount of deformation to the alpha helix. Once again using poly-alanine as the control, I chose increasing percentages of the helix breakers to substitute (12.5, 25, 50, 75, 100). The helix breaker amino acids are placed randomly in the poly alanine but in the given percentage. Five of these randomly mutated peptides are created for all 5 percentages and then the mean nitrogen to oxygen distance is found.
randomMutate takes a string (in this case it will take 15 A’s for poly alanine), the percent of the helix breaker amino and finally the FASTA letter of the helix breaker that will be substituted in.
To get a specific percent of total amino acids in a sequence to be a chosen amino acid the length of the string is calculated then multiplied into the chosen percentage and then rounded to get a whole number which is the number of chosen amino acids required.
12.5 percent substitution
12.5 percent substitution
5 random sequences are made with around 12.5 percent Glycine and the rest Alanine
The sequences are then folded using ESM fold to get accurate position of atoms
Finally distance between nitrogen and oxygen atoms in hydrogen bond is found for all 5 generated sequences.
Finding the mean of the N to O distances of each randomly mutated alpha helix and then finding the mean of all their individual means
25 percent substitution
25 percent substitution
Repeated but with 25 percent G
50 percent substitution
50 percent substitution
75 percent substitution
75 percent substitution
100 percent substitution
100 percent substitution
This list gives us the final values of the average distance between nitrogen and oxygen in each percent.
Substituting proline in specific percentages
Substituting proline in specific percentages
Same steps are repeated but with “P” (proline) instead of “G” (glycine).
12.5 percent substitution
12.5 percent substitution
25 percent substitution
25 percent substitution
50 percent substitution
50 percent substitution
75 percent substitution
75 percent substitution
100 percent substitution
100 percent substitution
Plot bar graphs for each set of data to analyze
Increasing the percentage of mutations causes a sharp, sudden collapse of the alpha-helix. At 12.5% mutation, the peptide chain is strong enough to handle the changes, keeping N to O distance near 3.0A. However, jumping to 25% more than doubles the N to O distance.This could be because the helix unwinds. Past 50% mutation, the distance levels off around 9A to 10A because the helix seems to be already completely destroyed and cannot unfold any further. At 100% it reduces as it is a homo-polymer which seems have stronger hydrogen bonding than 50% or 75%. Values for both Proline and Glycine follow a similar pattern even though Glycine has the smallest R group (an H atom) and Proline has an unusual ring shaped R group.
Analyzing how the position of proline effects the helix
Analyzing how the position of proline effects the helix
The position of a substitution mutation can determine the impact the mutation will have on the alpha helices structure. Depending on whether the mutation happens at a surface position, interior position or the helix caps it may alter the protein’s interaction with other molecules, destabilize the protein or cause the helix to unwind. Understanding the exact effect an amino acid would have based on where its substituted can help predict the nature of the mutated alpha helix.
To analyze this concept the 15 mutations of the 15 residue poly Alanine will be made . One Proline will be substituted at one position per peptide. These 15 peptides will then analyzed for helix radius. This is the distance from the central axis to the alpha carbon. In functional proteins, the precise radius of a helix allows specific side chains to interact with other molecules or receptors, making it an important property. It can also be used to compare whether the mutation causes it to coil tighter or loosen.
To analyze this concept the 15 mutations of the 15 residue poly Alanine will be made . One Proline will be substituted at one position per peptide. These 15 peptides will then analyzed for helix radius. This is the distance from the central axis to the alpha carbon. In functional proteins, the precise radius of a helix allows specific side chains to interact with other molecules or receptors, making it an important property. It can also be used to compare whether the mutation causes it to coil tighter or loosen.
To make finding the radius easier first the coordinates of the carbon backbone will be plotted on a 3D plane
Plotting molecule on a 3D plane
Plotting molecule on a 3D plane
Finds the coordinates of alpha carbons in Poly Alanine
Plots the carbon backbone coordinates on a 3D plane
Make the sequences with proline at each position
Plot all 15 mutated sequences on the 3D grid
Radius without mutation
Radius without mutation
To find the helix axis first the line of best fit for each axis (x, y, z) is found
Then the axis line is found by combining the best fit of x, y and z
The axis line and the carbon backbone are plotted on a 3D plane
Finally to find the radius the EuclideanDistance between a point on the carbon backbone plot and point on axis is calculated
Finding Radius of Mutations
Finding Radius of Mutations
The process of finding the axis line and then helixrRadii is repeated on mutations with proline on the 1st, 5th, 10th and 15th residues.
Mutation on 1
Mutation on 1
Mutation on 5
Mutation on 5
Mutation on 10
Mutation on 10
Mutation on 15
Mutation on 15
Finally the mean values of the radii of the control and 4 mutated molecules are plotted
All the radii were about the same size suggesting that possibly a single mutation isn’t enough to cause a change in radii. 3 of the mutated polymers have a smaller radius. Only the mutation with proline on the 10th residue has a greater radius.
Conclusion
Conclusion
Mutations were introduced systematically onto a poly-alanine control helix, ranging from single-residue substitutions across amino acids of varying size and side-chain properties, to percentage-based substitutions of known helix-breaking residues (glycine and proline). Mutated structures were then assessed using four complementary geometric measurements: carbon distance, which tracked backbone spacing between residues; N–O distance, which captured the integrity of the hydrogen bonds stabilizing the helical turn; torsion angle, which quantified local backbone twisting introduced at and around the mutation site; and helix radius, which measured how far each residue extended from the central helical axis. Using these four metrics in combination allowed both localized, atomic-level distortions and broader structural changes to the helix to be captured, providing a more complete picture of how a mutation’s identity, size, and position affect overall helical geometry than any single measurement could offer alone.
Future Directions
Future Directions
Going forward, this project could be expanded in a few ways. First, testing mutations in real protein helices (not just simple poly-alanine) would show if the same effects hold true in more realistic settings. Second, looking at multiple mutations happening together, rather than just one at a time, would show whether their effects add up or cancel out. Third, adding energy calculations alongside the geometry measurements would help show whether a distorted shape is actually unstable, or if the helix can still hold together fine. Fourth, testing the same mutation at different spots along the helix (not just one fixed spot) would show whether location matters as much as which amino acid is used. Finally, applying these same measurements to real disease-causing mutations could turn this method into a simple screening tool to predict whether a mutation is likely to be harmful, and testing helices as part of a full folded protein (instead of alone) would confirm whether these results hold up in real biological conditions.
References
References
◼
Baldwin, R . L . (n . d .) . Helix propensities of the amino acids . Stanford University . https : // rbaldwin . stanford . edu/PDFs/helix_propensities _of _the _amino _acids . pdf
◼
Pace, C. N., & Scholtz, J. M. (1998). A helix propensity scale based on experimental studies of peptides and proteins. Biophysical Journal, 75(1), 422–427. https://doi.org/10.1016/S0006-3495(98)77529-0
◼
Chou, P. Y., & Fasman, G. D. (1978). Empirical predictions of protein conformation. Biophysical Journal, 26(3), 367–383. https://doi.org/10.1016/S0006-3495(78)85460-6
◼
Baker, E. N., & Hubbard, R. E. (1984). Hydrogen bonding in globular proteins. Progress in Biophysics and Molecular Biology, 44(2), 97–179. https://doi.org/10.1016/0079-6107(84)90007-5
◼
Ghosh, T. (2023, July 14). Categorizing protein sequences based on foldings. Wolfram Community. https://community.wolfram.com/groups/-/m/t/2964475
Acknowledgements
Acknowledgements
I would like to thank my mentor, Renata Toro as well as Jason Sonnenberg for supporting and guiding me throughout this project. I would also like to thank the program directors, Rory Foulger, Megan Davis, Eryn Gillam as well as Stephen Wolfram for making this project possible . Thank you to the TAs who were always extremely helpful, especially Max Wang, Amrita Kumar. Finally, thank you to all the friends and peers I met for always keeping me inspired.
Additional thanks to Stephen Wolfram for suggesting this project.
CITE THIS NOTEBOOK
CITE THIS NOTEBOOK
Analysing geometrical effects of mutations on alpha helices
by Meher Sinha
Wolfram Community, STAFF PICKS, July 9, 2026
https://community.wolfram.com/groups/-/m/t/3754454
by Meher Sinha
Wolfram Community, STAFF PICKS, July 9, 2026
https://community.wolfram.com/groups/-/m/t/3754454