Mean Square Error Estimation of an MA(2) Signal
Mean Square Error Estimation of an MA(2) Signal


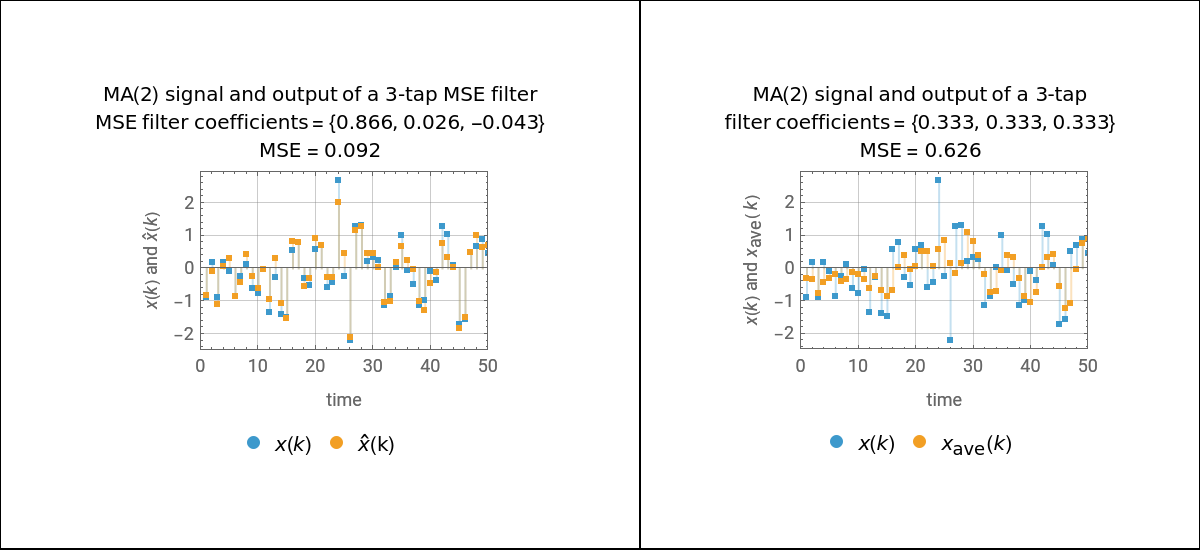
This Demonstration displays an MA(2) desired signal that is corrupted by white Gaussian noise, its mean square error (MSE) estimate (k) and the resulting simulated MSE (using 50,000 samples). The optimum tap weights are also displayed. Use the sliders to vary the parameters of the MA(2) signal model for , , and , as well as the Gaussian observation noise variance . For comparison, the performance of an equal weighted moving average filter is shown.
x(k)
x
h
i
x(k)
b
1
b
2
2
σ
w
2
σ
n
Details
Details
The desired signal is an MA(2) process—that is, , where is white Gaussian noise with zero mean and variance .
x(k)=w(k)+w(k-1)+w(k-2)
b
1
b
2
w(k)
2
σ
w
The observed signal is , where is white Gaussian observation noise with zero mean and variance .
y(k)=x(k)+n(k)
n(k)
2
σ
n
A three-tap finite impulse response (FIR) filter MSE estimate of is (k)=y(k)+y(k-1)+y(k-2).
x(k)
x
h
0
h
1
h
2
The optimum tap weights minimize .
h
i
E(x(k)-)(k)
2
x
Let the optimum tap weights filter be defined as ; is the autocorrelation of and is the cross-correlation between and .
h=(,,)
h
0
h
1
h
2
R
y
y(k)
r
xy
x(k)
y(k)
Then the optimum filter is found from , and the resulting MSE is (0)-h.
h=
-1
R
y
r
xy
R
x
r
xy
The initial values of =1, =1, =1/4 and =1/4 produce results that match Example 7.14[1, pp. 415–416].
b
1
b
2
2
σ
w
2
σ
n
A new desired MA(2) signal is created each time a system parameter is changed.
x(k)
References
References
[1] K. S. Shanmugan and A. M. Breipohl, Random Signals: Detection, Estimation and Data Analysis, New York: Wiley, 1991.
Permanent Citation
Permanent Citation
Victor S. Frost, University, Kansas
"Mean Square Error Estimation of an MA(2) Signal"
http://demonstrations.wolfram.com/MeanSquareErrorEstimationOfAnMA2Signal/
Wolfram Demonstrations Project
Published: September 26, 2025