Pressure-Volume Diagram for Heating a Vapor-Liquid Mixture at a Constant Volume
Pressure-Volume Diagram for Heating a Vapor-Liquid Mixture at a Constant Volume


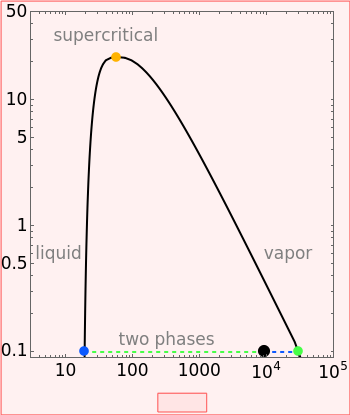

This Demonstration shows the phase behavior of 1 mol of water on a log pressure versus a log volume (-) phase diagram.
P
V
Use the sliders to change the specific volume and add heat at constant volume. The temperature, vapor quality and pressure are shown on the left. The cylinder fitted with a piston on the right represents the volumes of liquid (blue) and vapor (green) present. The critical point (orange), which is the highest temperature and pressure where two phases coexist, is at 647 K and 22.1 MPa for water. Depending on whether the volume selected is smaller or larger than the critical volume, the vapor phase or liquid phase volume decreases, respectively, as heat is added.
Details
Details
Mass and energy balances are used to calculate the pressure and quality when two phases are present:
U
i
L
U
V
U
V=q+(1-q)
V
V
L
V
where is internal energy (J/mol) at (the initial condition), is heat added (J), is vapor quality, is internal energy (J/mol) at the final condition, is volume (/mol) and the superscripts and are liquid and vapor.
U
i
P=0.1MPa
Q
q
U
V
3
cm
L
V
The internal energy at pressure is
P=0.1MPa
U
i
q
i
V
U
i
q
i
L
U
i
q
i
V-
L
V
i
V
V
i
L
V
i
External Links
External Links
Permanent Citation
Permanent Citation
Adam J. Johnston, Rachael L. Baumann, John L. Falconer
"Pressure-Volume Diagram for Heating a Vapor-Liquid Mixture at a Constant Volume"
http://demonstrations.wolfram.com/PressureVolumeDiagramForHeatingAVaporLiquidMixtureAtAConstan/
Wolfram Demonstrations Project
Published: September 27, 2017