Yellowstone National Park has long been known for its active geysers. These geysers are a surface indication of volcanic activity going on beneath the surface of the park. Yellowstone is actually the location of a super-volcano, a volcano with a very large magma reservoir. Yellowstone has had a history of many very large eruptions over the last 2 million years or so. The United States Geological Survey maintains data on the various volcanic calderas and related features which will be explored here. This data is in the form of SHP files and related data stored as a ZIP archive.
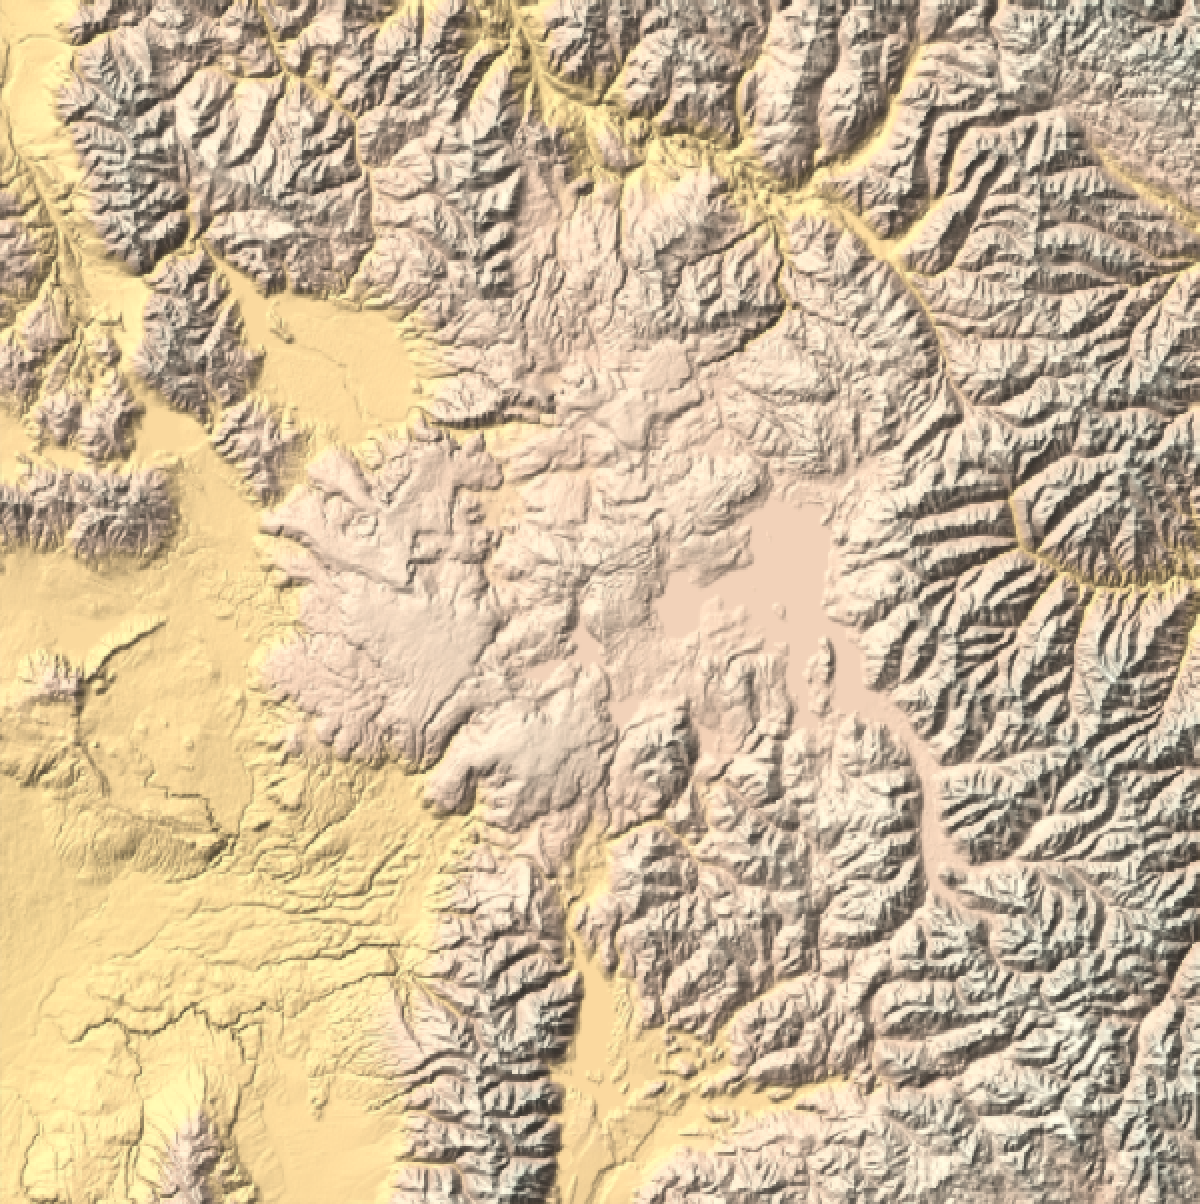
First, I want to examine the area of interest. The following generates a relief map of the data within 50 miles of the center of the Yellowstone volcano. Although there are some interesting features visible in the data, its not immediately clear where the volcanic calderas are, although some possible candidates are visible as flat areas among the surrounding mountainous terrain.
In[]:=
GeoGraphicsGeoBackground"ReliefMap",ImageSize600,GeoCenter,GeoRangeQuantity[50,"Miles"]
Out[]=
In order to gain a better understanding of the region, it is useful to pull in some additional data from the USGS in the form of a SHP file and the corresponding support files stored in a ZIP archive. In order to use this data, we need to understand the datum used so it can be properly transformed for representation using GeoGraphics.
In[]:=
csi=Import["https://www.wsgs.wyo.gov/gis-files/caldera.zip","CoordinateSystemInformation"]
Out[]=
PROJCS{NAD_1983_UTM_Zone_12N,GEOGCS{GCS_North_American_1983,DATUM{North_American_Datum_1983,SPHEROID{GRS_1980,6.37814×,298.257}},PRIMEM{Greenwich,0.},UNIT{Degree,0.0174533}},PROJECTION{Transverse_Mercator},PARAMETER{False_Easting,500000.},PARAMETER{False_Northing,0.},PARAMETER{Central_Meridian,-111.},PARAMETER{Scale_Factor,0.9996},PARAMETER{Latitude_Of_Origin,0.},UNIT{Meter,1.}}
6
10
Next, I extracted the data and labels.
In[]:=
shpdata=Import["https://www.wsgs.wyo.gov/gis-files/caldera.zip","Data"];
The data has various “properties” that can be extracted.
In[]:=
shpdata[[1,All,1]]
Out[]=
{LayerName,Geometry,Labels,LabeledData}
For my purposes, I only need the “Geometry” and “LabeledData”.
In[]:=
labeleddata="LabeledData"/.shpdata[[1]]
Out[]=
{LTYPE{Outer Ring Fault,Inner Ring Fault,Resurgent Dome,Outer Ring Fault,Outer Ring Fault,Outer Ring Fault,Outer Ring Fault,Outer Ring Fault,Outer Ring Fault,Outer Ring Fault,Caldera Rim,Outer Ring Fault,Outer Ring Fault,Outer Ring Fault,Resurgent Dome,Resurgent Dome,Caldera Rim,Caldera Rim,Caldera Rim,Outer Ring Fault},cycle{West Thumb,III,III,II,II,I,I,I,I,I,III,III,III,III,III,III,III,III,III,III},Shape_Leng{23741.7,175351.,48118.3,60942.8,9980.28,11407.1,725.149,40874.9,35689.,196769.,13871.6,11718.8,86414.3,57881.,37795.4,1197.5,43561.9,44777.,120815.,44777.},Shape_Le_1{23741.7,175351.,48118.3,60942.8,9980.28,11407.1,725.149,40874.9,35689.,196769.,13871.6,11718.8,86414.3,57881.,37795.4,1197.5,43561.9,44777.,120815.,44777.}}
In[]:=
labels="LTYPE"/.labeleddata;
In[]:=
lines="Geometry"/.shpdata[[1]];
With the data extracted, I can use the “CoordinateSystemInformation” extracted above to transform the data via GeoGridPosition.
In[]:=
convertedlines=lines/.Line[data_]Line[GeoGridPosition[data,"UTMZone12","NAD831986"]];
For stylistic reasons, I chose some distinct colors to represent the various labels found in the data.
In[]:=
color["Outer Ring Fault"]=White;color["Inner Ring Fault"]=Red;color["Resurgent Dome"]=Yellow;color["Caldera Rim"]=Black;
I combined the colors and labels along with a tooltip.
In[]:=
coloredtooltip[line_,label_]:={color[label],Tooltip[line,label]}
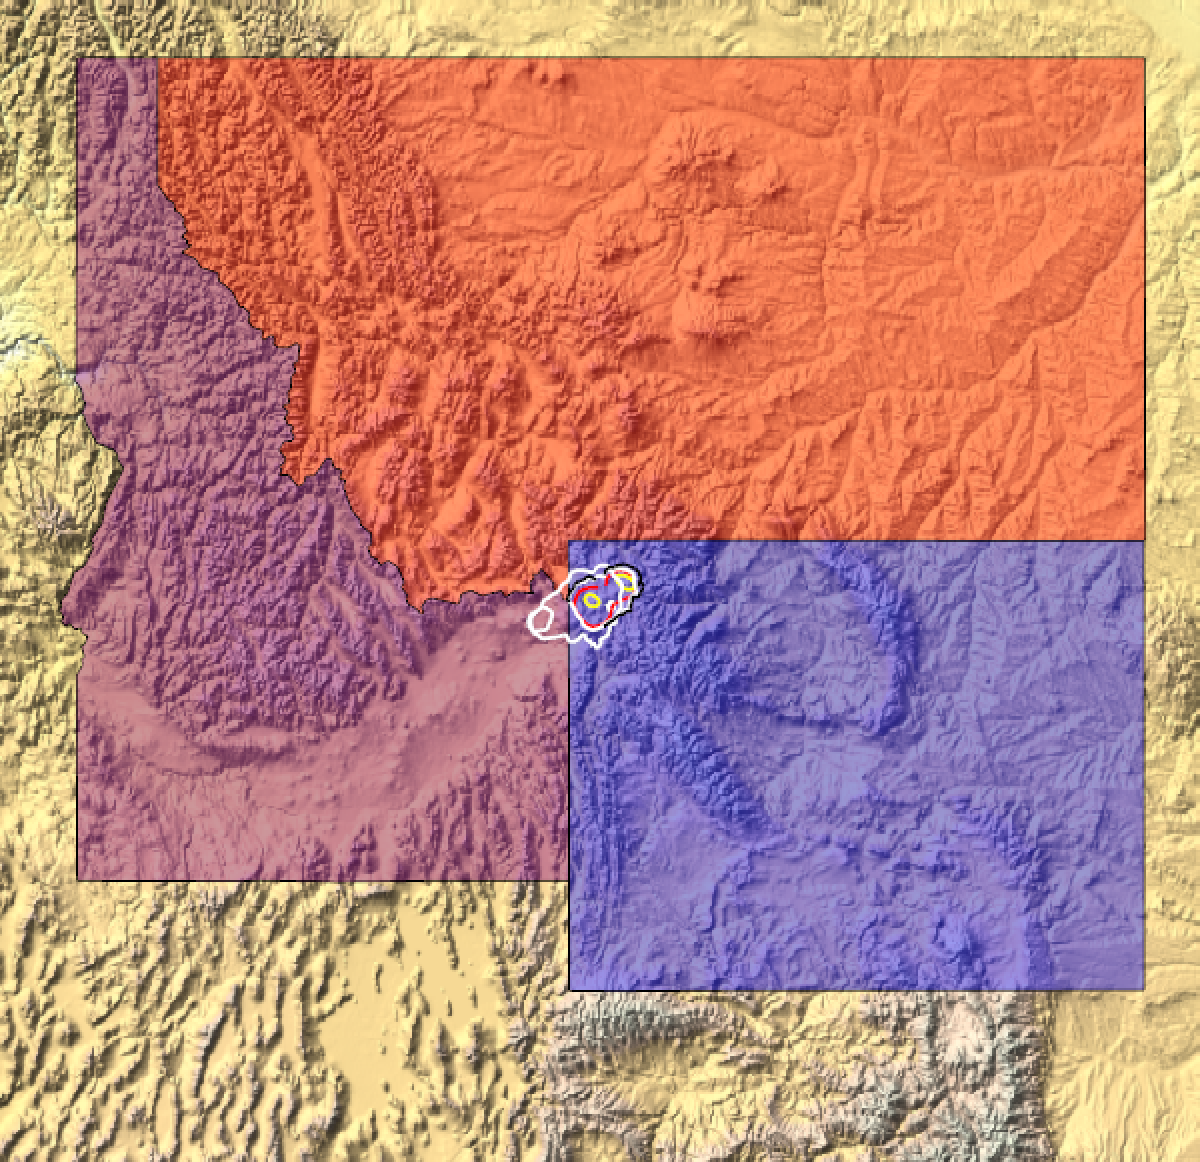
For a sense of scale, I have included the state outlines for Wyoming, Idaho, and Montana with the data drawn using colored lines. The extent of the Yellowstone calderas is quite impressive.
In[]:=
GeoGraphicsEdgeForm[Black],GeoStyling[Opacity[.4]],Red,Polygon,Purple,Polygon,Blue,Polygon,Thickness[.003],coloredtooltip@@@Transpose[{convertedlines,labels}],GeoBackground"ReliefMap",ImageSize600,GeoCenter
Out[]=
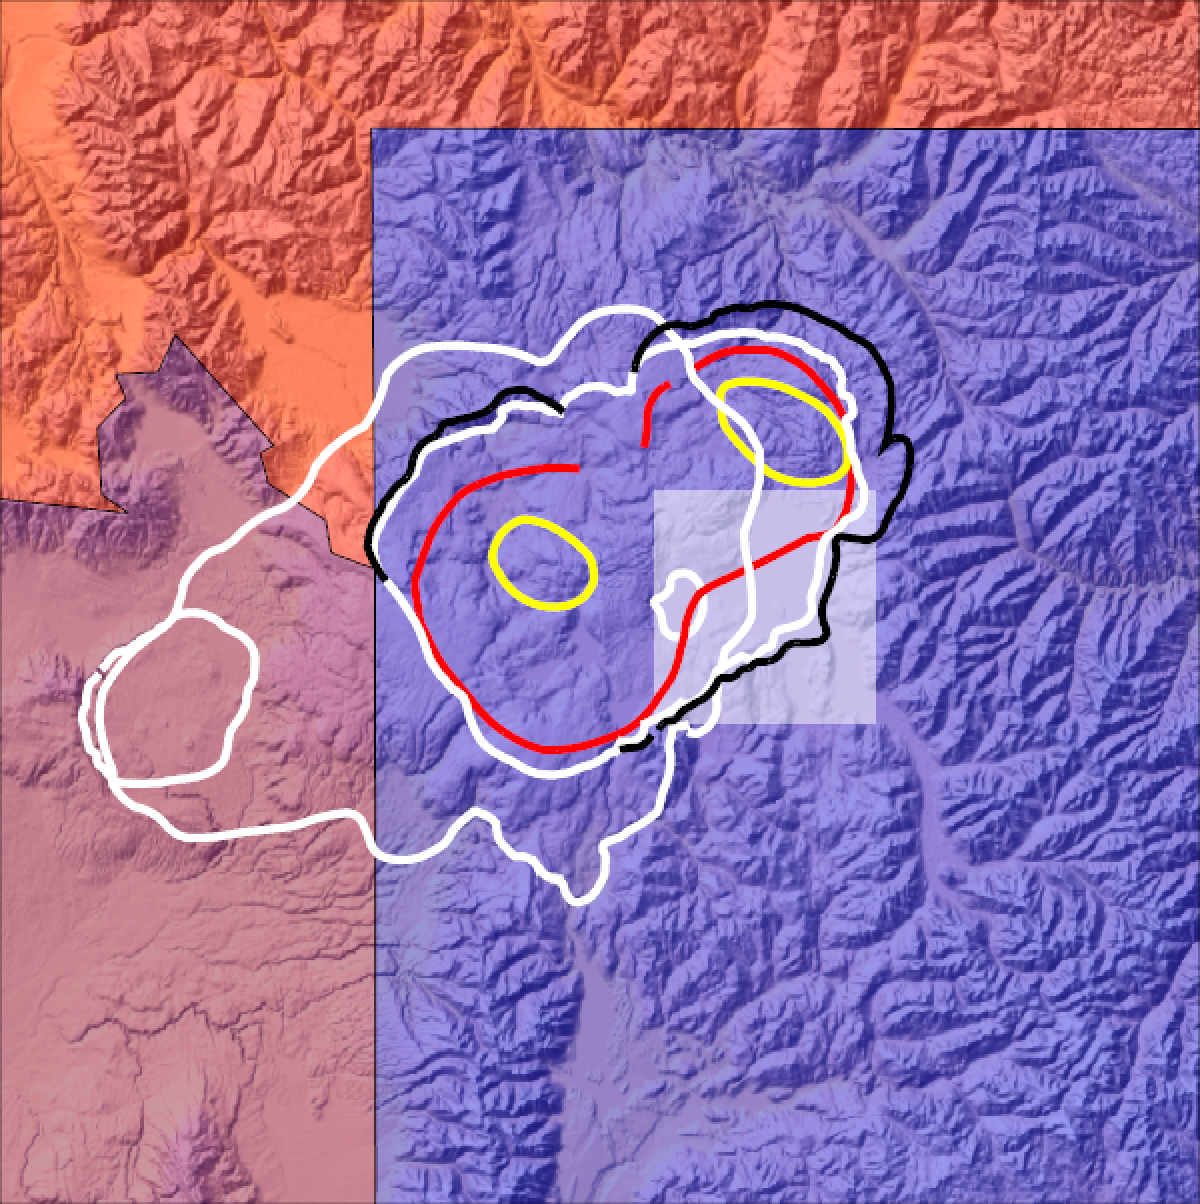
Zooming in on Yellowstone with a radius of 50 miles shows more detail. Some of the faults and rims of the various calderas correspond to visible surface features. A pair of resurgent domes (yellow circular features) can be found within the data. These domes are areas where uplift occurred due to follow-up eruptions within older calderas. A useful surface marker is the location of Yellowstone Lake shown as a white rectangle.
In[]:=
yellowstonelake=Rectangle[GeoPosition[{Latitude[#[[1]]],Longitude[#[[2]]]}],GeoPosition[{Latitude[#[[3]]],Longitude[#[[4]]]}]]&@[{"SouthernmostPoint","WesternmostPoint","NorthernmostPoint","EasternmostPoint"}];
In[]:=
GeoGraphicsEdgeForm[Black],GeoStyling[Opacity[.4]],Red,Polygon,Purple,Polygon,Blue,Polygon,{EdgeForm[],White,Opacity[.5],yellowstonelake},Thickness[.007],coloredtooltip@@@Transpose[{convertedlines,labels}],GeoBackground"ReliefMap",ImageSize600,GeoCenter,GeoRangeQuantity[50,"Miles"]
Out[]=