Take a surface mesh
Take a surface mesh
In[]:=
mr= ;
Extract its xyz point coordinates
Extract its xyz point coordinates
In[]:=
xyz=MeshCoordinates[mr];
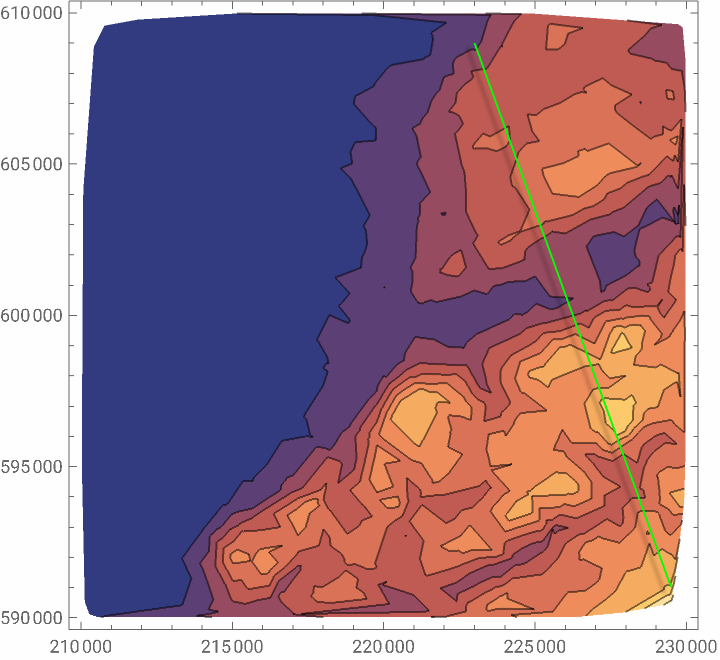
Contour the surface elevation data and define a section line
Contour the surface elevation data and define a section line
In[]:=
ListContourPlot[RandomSample[xyz,1000],Epilog->{Green,DropShadowing[],Line[sectionLine={{223000,609000},{229500,591000}}]}]
Out[]=

Get an interpolating function
Get an interpolating function
In[]:=
ifun=Interpolation[xyz/.{x_,y_,z_}->{{x,y},z},InterpolationOrder->1]
Out[]=
InterpolatingFunction


Define xy points along the section line
Define xy points along the section line
In[]:=
sectionLineLength=EuclideanDistance@@sectionLine;sectionLineUnitVector=Normalize[Subtract@@@Reverse/@Transpose[sectionLine]];nSectionPts=10000;segmentLength=sectionLineLength/(nSectionPts-1)//N;xySectionPts=Table[sectionLine[[1]]+i*segmentLength*sectionLineUnitVector,{i,0,nSectionPts}]
Out[]=
Interpolate elevation (z) values at all xy points along the section line
Interpolate elevation (z) values at all xy points along the section line
In[]:=
xyzSectionPts=xySectionPts/.{x_,y_}->{x,y,ifun[x,y]};
In[]:=
Show[mr,Graphics3D[{Red,Thickness[Large],Line[xyzSectionPts]}],Boxed->True,BoxRatios->{Automatic,Automatic,10000},ImageSize->Large,SphericalRegion->True]
Out[]=

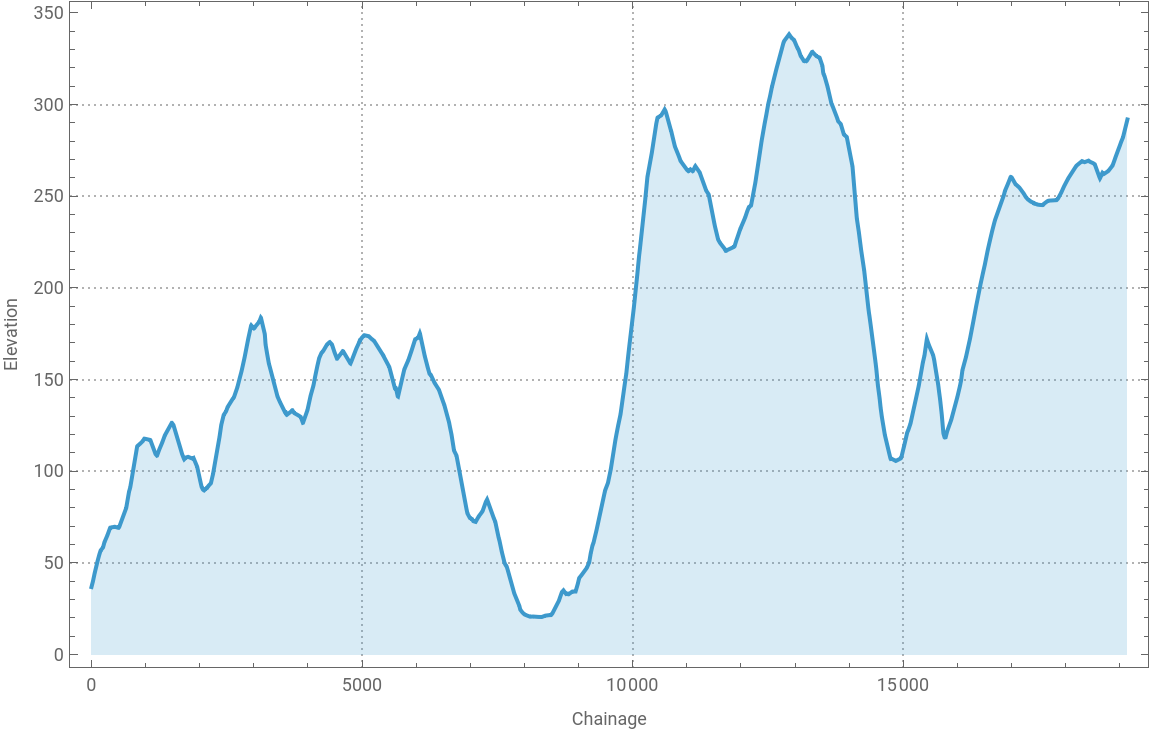
Plot the section in 2D
Plot the section in 2D
In[]:=
chzSectionPts=xyzSectionPts/.{x_,y_,z_}->{EuclideanDistance[{x,y},xySectionPts[[1,1;;2]]],z};ListLinePlot[chzSectionPts,Filling->Bottom,FrameLabel->{"Chainage","Elevation"}]
Out[]=